XX D P O
This tool for MetaTrader 5 is specifically engineered to streamline your trading operations. This technical indicator acts as a specialized analysis tool designed to visualize market data. It helps traders identify emerging trends, momentum shifts, and key support or resistance levels by plotting statistical calculations directly onto price charts.
How to Setup and Use XX D P O
1. Installation: Place your file in the MQL/Indicators folder via "Open Data Folder" and restart your terminal.
2. Loading: Find the indicator in the Navigator, drag it onto your chart, and configure the input parameters in the popup window.
3. Customization: Press Ctrl+I to open the indicator list, select your tool, and click "Properties" to change colors, levels, or visual styles.
4. Updating: Replace the old file in the Indicators folder with the new version and restart the platform to apply changes.
Frequently Asked Questions
Q: Why is my indicator not showing? A: Verify the file is in the MQL/Indicators folder, or try right-clicking the "Indicators" tree in the Navigator and clicking "Refresh."
Q: Do custom indicators slow down the platform? A: Too many complex indicators can impact performance; remove unused ones via the "Indicator List" (Ctrl+I).
Q: Can I use MT4 indicators on MT5? A: No, MQL4 and MQL5 are distinct languages; ensure the indicator is compiled specifically for your platform version.
Description & Settings
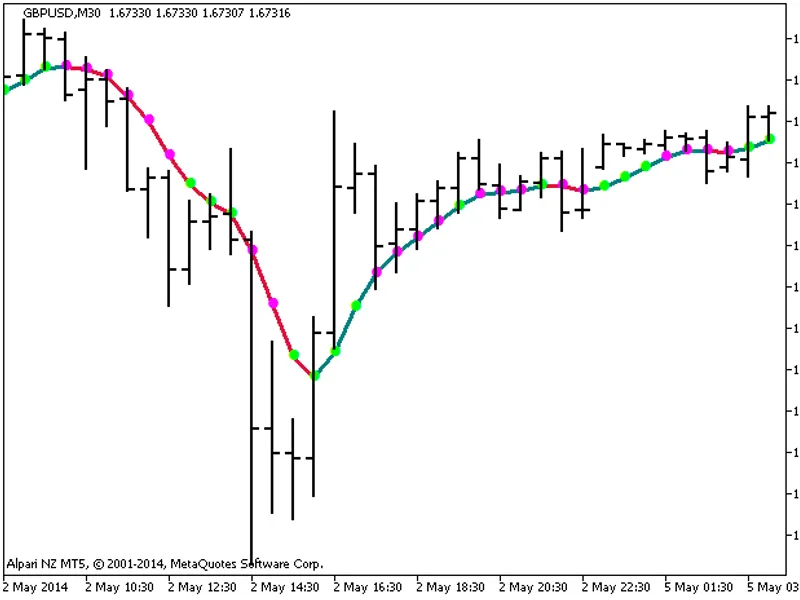
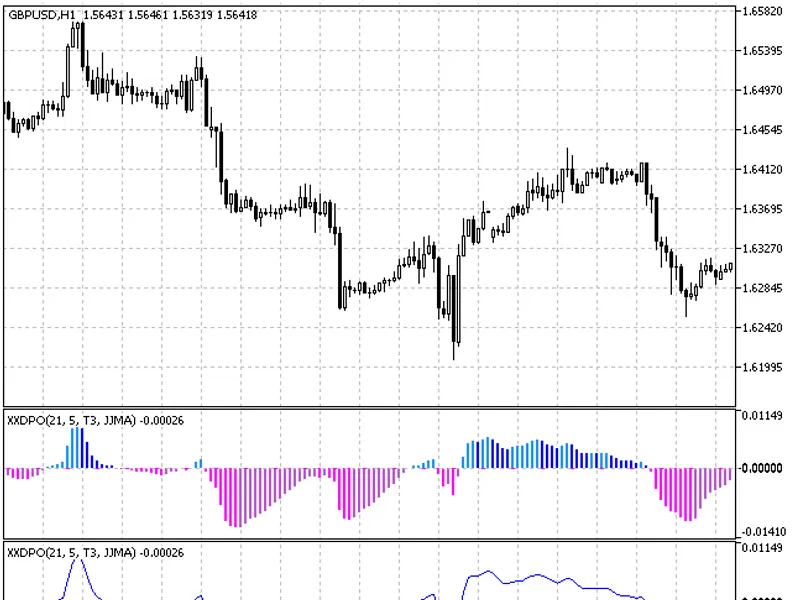
is a technical indicator that shows the market overbought/oversold states and also can be used for getting buy/sell signals.
It sorts out trends to concentrate on basic price movement cycles. To achieve this, the moving average transforms into the line and price changes below and above it become a trend oscillator.
This indicator is used to highlight short-term cycles, as the analysis of short-term components of the long-term cycles can be useful in determining main reversal points of the latter. DPO does not consider long-term prices cycles making short-term cycles more noticeable.
Calculation:
where:
XMA - smoothing algorithm;
Price[] - current price of a financial asset;
SMOOTH_Period - final indicator smoothing period;
DPO_Period - DPO smoothing period;
bar - bar index.
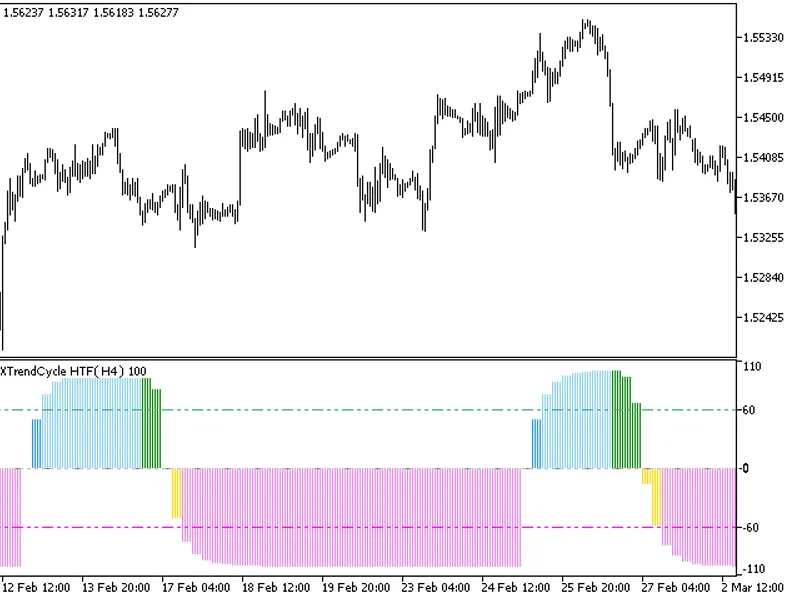
Working with trading signals:
If DPO is above its zero line (i.e., the price is above its moving average), it is a bullish signal. If DPO is below the zero line (i.e., the price is below its moving averages), it is a bearish signal.
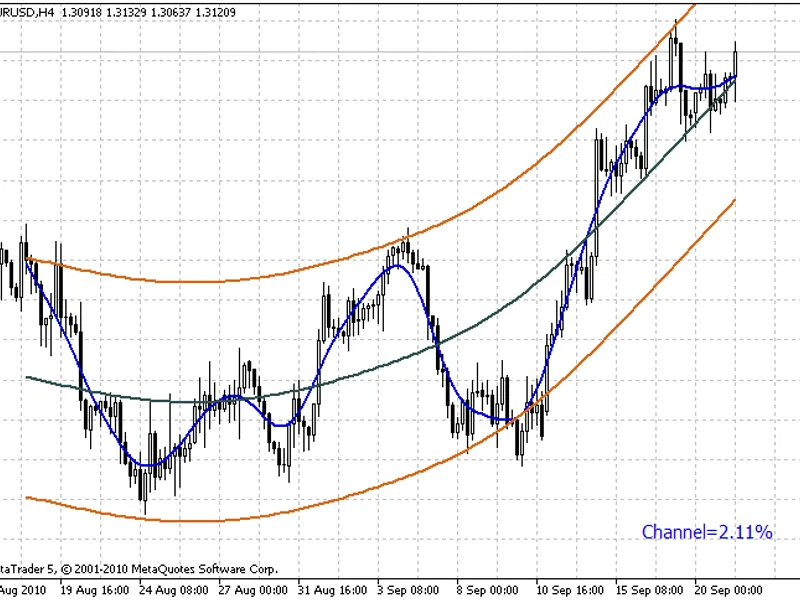
Long-term cycles reversal points (divergencies):
If the chart formed a higher peak or deeper depression, you should wait for a price turn up/down;
if a peak or a bottom is lower/higher than the previous one, the price will fall.
There are two buy/sell signals interpretations.
We should buy when:
DPO crosses the zero line upwards;
DPO is located in the oversold area confirmed by previous lows and at the same time the upper line of the channel is being broken both by DPO and the price that is limiting descending price movement.
We should sell when:
DPO crosses the zero line downwards;
DPO is located in the overbought area confirmed by previous maximums and at the same time both DPO and the price are breaking a support line of an ascending trend.
The indicator is rarely used for getting trading signals. It should be noted that the indicator can be effective enough only when it is used together with other indicators. Nevertheless, it is a useful tool revealing the cycles for setting the optimal width of other indicators windows.
- simple moving average;
- exponential moving average;
- smoothed moving average;
- linear weighted moving average;
- JMA adaptive average;
- ultralinear smoothing;
- parabolic smoothing;
- Tillson's multiple exponential smoothing;
- smoothing with the use of Tushar Chande's algorithm;;
- smoothing with the use of Perry Kaufman's algorithm.
It should be noted that Phase1 and Phase2 parameters have completely different meaning for different smoothing algorithms. For JMA it is an external Phase variable changing from -100 to +100. For T3 it is a smoothing ratio multiplied by 100 for better visualization, for VIDYA it is a CMO oscillator period and for AMA it is a slow EMA period. In other algorithms these parameters do not affect smoothing. For AMA fast EMA period is a fixed value and is equal to 2 by default. The ratio of raising to the power is also equal to 2 for AMA.
The indicator uses SmoothAlgorithms.mqh library classes (must be copied to the terminal_data_folder\MQL5\Include). The use of the classes was thoroughly described in the article .