X-bars Fractals
This professional-grade solution for MetaTrader 5 helps traders achieve greater efficiency in their daily workflow. This technical indicator acts as a specialized analysis tool designed to visualize market data. It helps traders identify emerging trends, momentum shifts, and key support or resistance levels by plotting statistical calculations directly onto price charts.
How to Setup and Use X-bars Fractals
1. Installation: Place your file in the MQL/Indicators folder via "Open Data Folder" and restart your terminal.
2. Loading: Find the indicator in the Navigator, drag it onto your chart, and configure the input parameters in the popup window.
3. Customization: Press Ctrl+I to open the indicator list, select your tool, and click "Properties" to change colors, levels, or visual styles.
4. Updating: Replace the old file in the Indicators folder with the new version and restart the platform to apply changes.
Frequently Asked Questions
Q: Why is my indicator not showing? A: Verify the file is in the MQL/Indicators folder, or try right-clicking the "Indicators" tree in the Navigator and clicking "Refresh."
Q: Do custom indicators slow down the platform? A: Too many complex indicators can impact performance; remove unused ones via the "Indicator List" (Ctrl+I).
Q: Can I use MT4 indicators on MT5? A: No, MQL4 and MQL5 are distinct languages; ensure the indicator is compiled specifically for your platform version.
Description & Settings
It differs from fractals indicator in the following:
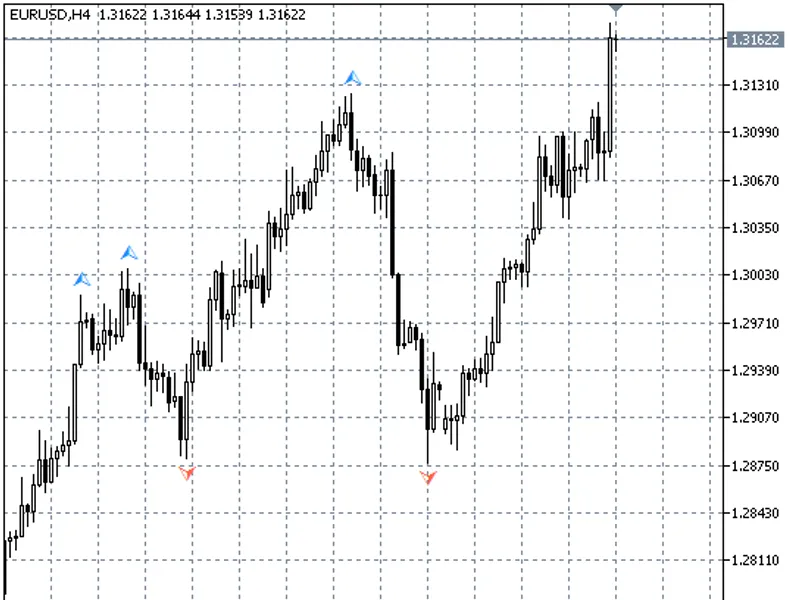
allows drawing fractals with any number of bars on either side of the fractal;
allows drawing the so-called asymmetric fractals by displaying different number of bars on the left and the right of the extremum.
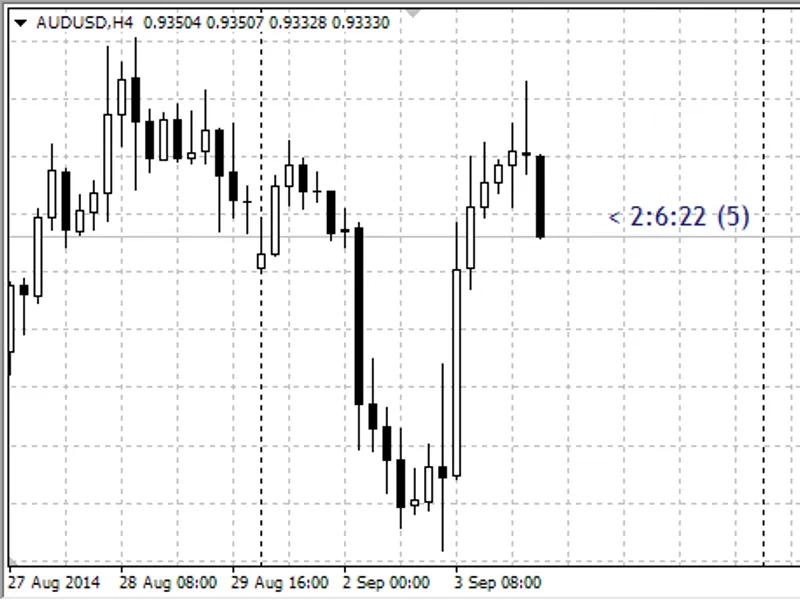
The fractal with sides 10 (left) and 5 (right):
Recommendations:
The indicator with a large parameter sides perfectly defines global minimum / maximum, which can be a significant support / resistance levels, as well as be one of the points ro draw trend lines (which, for example, was used in the indicator of );
Asymmetric parameters are good for filtering out the fractals which are unlikely to be local minimums / maximums. To make sure you can compare, for example, the parameters of (2, 2), which are identical to the standard fractals, and the parameters of (7, 2).