Wick Rejection Scanner Dashboard (Multi-Symbol / Multi-TF)
This tool for MetaTrader 5 is specifically engineered to streamline your trading operations. This technical indicator acts as a specialized analysis tool designed to visualize market data. It helps traders identify emerging trends, momentum shifts, and key support or resistance levels by plotting statistical calculations directly onto price charts.
How to Setup and Use Wick Rejection Scanner Dashboard (Multi-Symbol / Multi-TF)
1. Installation: Place your file in the MQL/Indicators folder via "Open Data Folder" and restart your terminal.
2. Loading: Find the indicator in the Navigator, drag it onto your chart, and configure the input parameters in the popup window.
3. Customization: Press Ctrl+I to open the indicator list, select your tool, and click "Properties" to change colors, levels, or visual styles.
4. Updating: Replace the old file in the Indicators folder with the new version and restart the platform to apply changes.
Frequently Asked Questions
Q: Why is my indicator not showing? A: Verify the file is in the MQL/Indicators folder, or try right-clicking the "Indicators" tree in the Navigator and clicking "Refresh."
Q: Do custom indicators slow down the platform? A: Too many complex indicators can impact performance; remove unused ones via the "Indicator List" (Ctrl+I).
Q: Can I use MT4 indicators on MT5? A: No, MQL4 and MQL5 are distinct languages; ensure the indicator is compiled specifically for your platform version.
Description & Settings
Wick Rejection Scanner Dashboard
is a professional MT5 indicator that continuously scans multiple symbols and timeframes for
wick-based rejection candles
(upper or lower rejection) and presents the most relevant results in a
clear, readable on-chart dashboard
.
It is built for traders who use
price action / rejection candles
as a trigger, but want a faster way to monitor a watchlist without manually opening and checking dozens of charts. The tool acts like a “radar”: it finds recent rejection candles and ranks them using a
strength score
and
context filter
, helping you focus only on the most meaningful setups.
This is a
scanner + visualizer
. It does
not
place trades.
What the Indicator Detects
A signal is produced when a candle meets configurable rejection rules, including:
Dominant wick
(upper or lower) as a percentage of the full candle range
Minimum candle range
filter to avoid tiny/noisy candles
Minimum body size
to avoid meaningless “needle” bars
Opposite wick cap
to avoid “indecision” candles with large wicks on both sides
Optional
ATR filter
so signals occur only during sufficient volatility
Optional
Trend Context score
to penalize signals occurring in weak locations inside the recent range
The result is a set of rejection signals that is designed to be
realistic
, not overly sensitive.
Key Features
Multi-Symbol Scanner
Scan symbols from
Market Watch
or from a
custom comma-separated list
Limit the number of scanned symbols for performance control
Multi-Timeframe Support
Scan the
current chart timeframe
or a fixed timeframe
Optional additional scans for
M15
and
H4
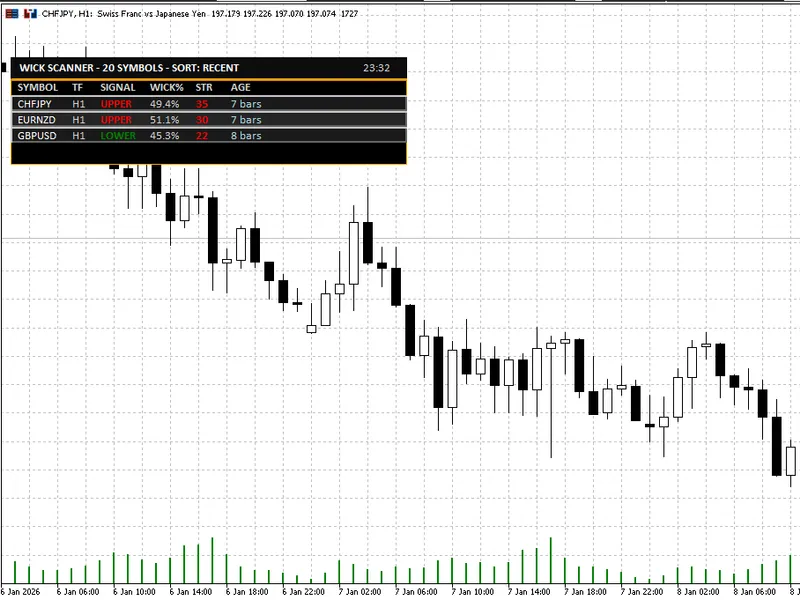
Professional Dashboard UI
Clean dark theme dashboard with consistent spacing and alignment
Displays:
Symbol, Timeframe, Signal Type, Wick %, Strength, Age
Sorting modes
: Most Recent / Highest Wick% / Highest Strength
Shows a compact
signal age
(bars ago or time for very recent signals)
Click-to-Switch Chart
Click a dashboard row to instantly switch the chart to that
symbol + timeframe
On-Chart Markers (Optional)
Draw arrows on the chart for detected signals
Optional wick percentage labels
Maximum marker count for performance and readability
Typical Use Cases
Watchlist scanning for rejection candles at important levels
Quick filtering before manual confirmation (S/R, trend structure, session timing, liquidity sweeps)
A dedicated “setup radar” on a secondary monitor
Notes and Best Practice
A wick rejection candle is a
trigger
, not a complete strategy.
For higher quality trade decisions, combine signals with:
Support/Resistance zones
Trend structure (HH/HL or LH/LL)
Higher timeframe bias
Session timing / volatility conditions
Inputs (What You Can Configure)
Detection Settings
Wick threshold (% of candle range)
Minimum candle range (points)
Minimum body percentage
Maximum opposite wick percentage
ATR-based validation (period + multiplier)
Trend context scoring (lookback + threshold)
Scanner Settings
Market Watch symbols or custom symbol list
Scan timeframe selection (or current chart timeframe)
Optional extra timeframes (M15 / H4)
Bars to check + refresh interval
Optional limit for maximum displayed signals
UI & Alerts
Dashboard position, offsets, row height, font size
Marker visibility, label visibility, max markers
Alert channels and cooldown
Summary
If you trade wick rejections and want a faster workflow,
Wick Rejection Scanner Dashboard
helps you:
scan more charts in less time,
reduce noise using practical filters, and
focus on the best candidates via strength scoring and sorting.