Velocity - normalized
This software component for MetaTrader 5 is built to enhance the capabilities of your trading environment. This technical indicator acts as a specialized analysis tool designed to visualize market data. It helps traders identify emerging trends, momentum shifts, and key support or resistance levels by plotting statistical calculations directly onto price charts.
How to Setup and Use Velocity - normalized
1. Installation: Place your file in the MQL/Indicators folder via "Open Data Folder" and restart your terminal.
2. Loading: Find the indicator in the Navigator, drag it onto your chart, and configure the input parameters in the popup window.
3. Customization: Press Ctrl+I to open the indicator list, select your tool, and click "Properties" to change colors, levels, or visual styles.
4. Updating: Replace the old file in the Indicators folder with the new version and restart the platform to apply changes.
Frequently Asked Questions
Q: Why is my indicator not showing? A: Verify the file is in the MQL/Indicators folder, or try right-clicking the "Indicators" tree in the Navigator and clicking "Refresh."
Q: Do custom indicators slow down the platform? A: Too many complex indicators can impact performance; remove unused ones via the "Indicator List" (Ctrl+I).
Q: Can I use MT4 indicators on MT5? A: No, MQL4 and MQL5 are distinct languages; ensure the indicator is compiled specifically for your platform version.
Description & Settings
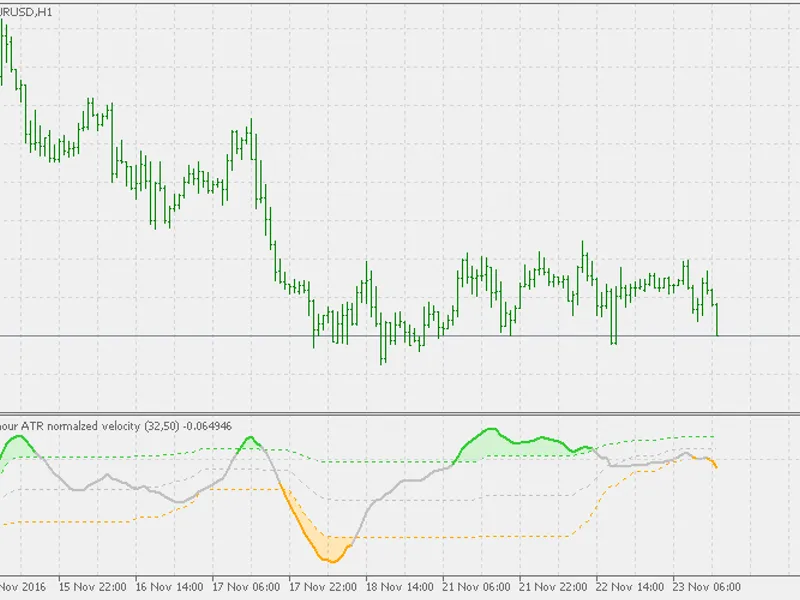
Velocity (which is often called a "smoother momentum" since it is much smoother than momentum without lagging at all) with an addition of 3 types of normalization:
ATR normalization
standard deviation without sample correction
standard deviation with sample correction
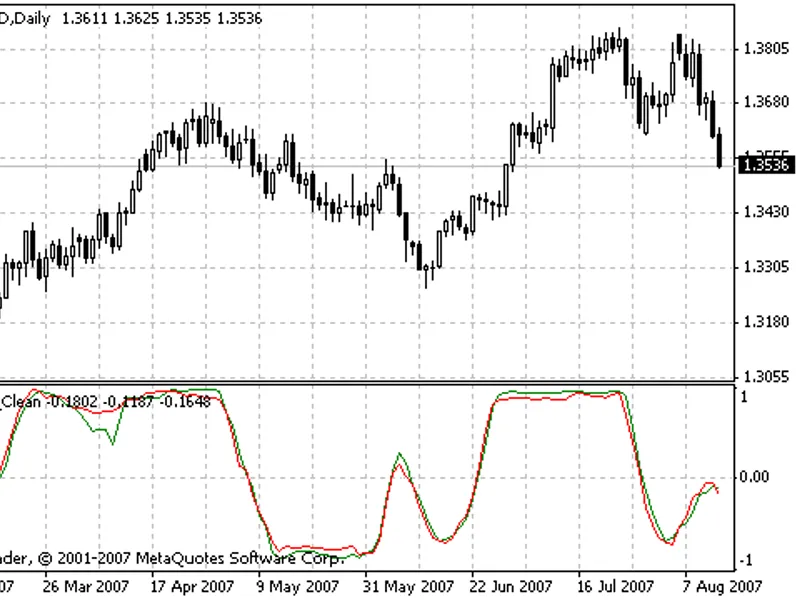
Also, since velocity is (even when normalization is applied), not an indicator with fixed bounds, this indicator is using floating levels for what is usually called overbought and oversold levels (+ a floating "zero" line is added). Something that would look like a "fixed levels" is easily achieved if you use long floating levels period in which case those levels are quite similar to fixed levels.
Indicator can be used like any momentum indicator (in that case recommended coloring mode is to use either slope coloring or "zero" middle level crossing coloring) or it can be used as a "trending" indicator in which case it is better to use coloring on outer level cross, and longer calculation periods are advised in that case.