Vector
This tool for MetaTrader 5 is specifically engineered to streamline your trading operations. This technical indicator acts as a specialized analysis tool designed to visualize market data. It helps traders identify emerging trends, momentum shifts, and key support or resistance levels by plotting statistical calculations directly onto price charts.
How to Setup and Use Vector
1. Installation: Place your file in the MQL/Indicators folder via "Open Data Folder" and restart your terminal.
2. Loading: Find the indicator in the Navigator, drag it onto your chart, and configure the input parameters in the popup window.
3. Customization: Press Ctrl+I to open the indicator list, select your tool, and click "Properties" to change colors, levels, or visual styles.
4. Updating: Replace the old file in the Indicators folder with the new version and restart the platform to apply changes.
Frequently Asked Questions
Q: Why is my indicator not showing? A: Verify the file is in the MQL/Indicators folder, or try right-clicking the "Indicators" tree in the Navigator and clicking "Refresh."
Q: Do custom indicators slow down the platform? A: Too many complex indicators can impact performance; remove unused ones via the "Indicator List" (Ctrl+I).
Q: Can I use MT4 indicators on MT5? A: No, MQL4 and MQL5 are distinct languages; ensure the indicator is compiled specifically for your platform version.
Description & Settings
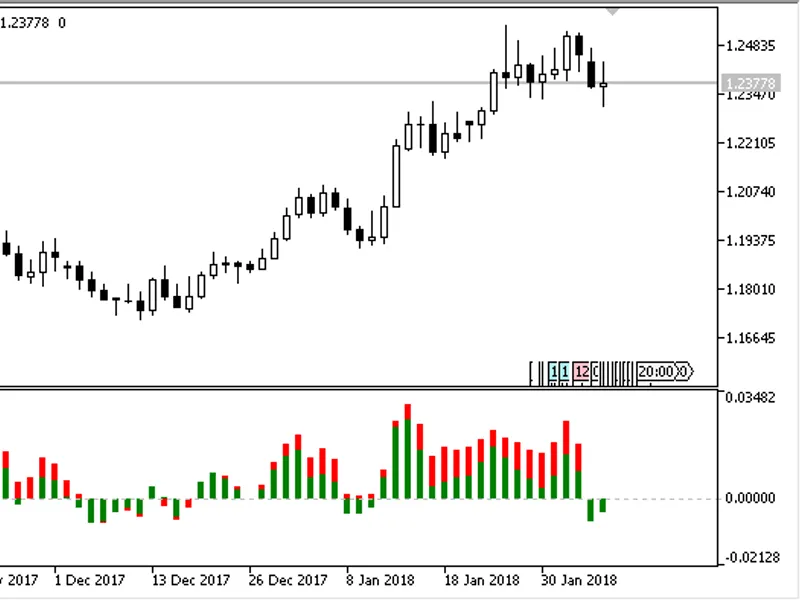
The Vector indicator tracks the market state and generates relatively few false signals. Signals are formed when the zero line is crossed.
The indicator has two oscillators - the fast and the slow one. The total of their values allows evaluating the mood of the market.
If the fast (green) vector completely blocks the slow (red) one, this indicates the beginning of a new trend formation;
If the slow (red) oscillator begins to prevail over the fast (green) one, this indicates a slowdown of the trend, which, however, may continue to fade for some time;
The market inertia is represented by a slow oscillator, and the trends are represented by the fast one.
The combined values of the two oscillators provide a picture of the market, which is sufficient for making a decision to buy/sell or to close existing positions.
The indicator has two input parameters:
Inertia osc color
- the color of the inertia oscillator;
Trend osc color
- the color of the trend oscillator.


![Schnick [Support Vector Machine Learning Tool Tester - DE M O]](/images/1370.webp)