Triple Exponential Moving Average (TE M A)
This is a powerful addition to your MetaTrader 5 toolkit designed to optimize market analysis and performance. This technical indicator acts as a specialized analysis tool designed to visualize market data. It helps traders identify emerging trends, momentum shifts, and key support or resistance levels by plotting statistical calculations directly onto price charts.
How to Setup and Use Triple Exponential Moving Average (TE M A)
1. Installation: Place your file in the MQL/Indicators folder via "Open Data Folder" and restart your terminal.
2. Loading: Find the indicator in the Navigator, drag it onto your chart, and configure the input parameters in the popup window.
3. Customization: Press Ctrl+I to open the indicator list, select your tool, and click "Properties" to change colors, levels, or visual styles.
4. Updating: Replace the old file in the Indicators folder with the new version and restart the platform to apply changes.
Frequently Asked Questions
Q: Why is my indicator not showing? A: Verify the file is in the MQL/Indicators folder, or try right-clicking the "Indicators" tree in the Navigator and clicking "Refresh."
Q: Do custom indicators slow down the platform? A: Too many complex indicators can impact performance; remove unused ones via the "Indicator List" (Ctrl+I).
Q: Can I use MT4 indicators on MT5? A: No, MQL4 and MQL5 are distinct languages; ensure the indicator is compiled specifically for your platform version.
Description & Settings
Triple Exponential Moving Average (TEMA) technical indicator was developed by Patrick Mulloy and published in the "Technical Analysis of Stocks & Commodities" magazine.
The principle of its calculation is similar to Double Exponential Moving Average (DEMA). The name "Triple Exponential Moving Average" does not very correctly reflect its algorithm. This is a unique blend of the single, double and triple exponential smoothing average providing the smaller lag than each of them separately.
TEMA can be used instead of traditional moving averages. It can be used for smoothing price data, as well as for smoothing other indicators.
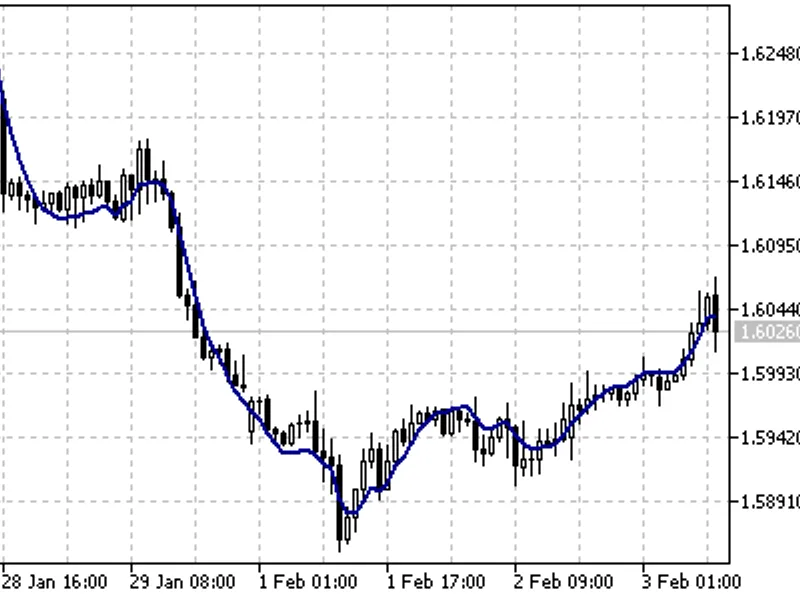
Triple Exponential Moving Average Indicator
Calculation:
First DEMA is calculated, then the error of price deviation from DEMA is calculated:
err(i) = Price(i) - DEMA(Price, N, ii)
where:
err(i) - current DEMA error;
Price(i) - current price;
DEMA(Price, N, i) - current DEMA value from Price series with N period.
Then add value of the exponential average of the error and get TEMA:
TEMA(i) = DEMA(Price, N, i) + EMA(err, N, i) = DEMA(Price, N, i) + EMA(Price - EMA(Price, N, i), N, i) == DEMA(Price, N, i) + EMA(Price - DEMA(Price, N, i), N, i) = 3 * EMA(Price, N, i) - 3 * EMA2(Price, N, i) + EMA3(Price, N, i)
where:
EMA(err, N, i) - current value of the exponential average of the err error;
EMA2(Price, N, i) - current value of the double sequential price smoothing;
EMA3(Price, N, i) - current value of the triple sequential price smoothing.