Trendless OS
This professional-grade solution for MetaTrader 5 helps traders achieve greater efficiency in their daily workflow. This technical indicator acts as a specialized analysis tool designed to visualize market data. It helps traders identify emerging trends, momentum shifts, and key support or resistance levels by plotting statistical calculations directly onto price charts.
How to Setup and Use Trendless OS
1. Installation: Place your file in the MQL/Indicators folder via "Open Data Folder" and restart your terminal.
2. Loading: Find the indicator in the Navigator, drag it onto your chart, and configure the input parameters in the popup window.
3. Customization: Press Ctrl+I to open the indicator list, select your tool, and click "Properties" to change colors, levels, or visual styles.
4. Updating: Replace the old file in the Indicators folder with the new version and restart the platform to apply changes.
Frequently Asked Questions
Q: Why is my indicator not showing? A: Verify the file is in the MQL/Indicators folder, or try right-clicking the "Indicators" tree in the Navigator and clicking "Refresh."
Q: Do custom indicators slow down the platform? A: Too many complex indicators can impact performance; remove unused ones via the "Indicator List" (Ctrl+I).
Q: Can I use MT4 indicators on MT5? A: No, MQL4 and MQL5 are distinct languages; ensure the indicator is compiled specifically for your platform version.
Description & Settings
Trendless OS DiNapoli was developed by Joe DiNapoli in 1980's and was described in his book "Trading with DiNapoli Levels". Like other his indicators, Trendless OS is an addition to the main decision-making tools - Fibonacci levels. Moreover, according to DiNapoli's concept, the Trendless indicator can be used as an independent trading tool. Individual level settings should be selected for each traded asset.
There are five inputs:
Period
- calculation period
Applied price
Overbought
- overbought level
Oversold
- oversold level
Drawing type
- oscillator display type
Line
Histogram
Calculation:
Two additional display types are provided for the indicator: line (standard) and a color histogram, which shows bars in different colors depending on the position of the oscillator line relative to its levels. Two more levels are available in addition to the overbought and oversold levels: 0.6 and 0.8 of the value given in the settings.
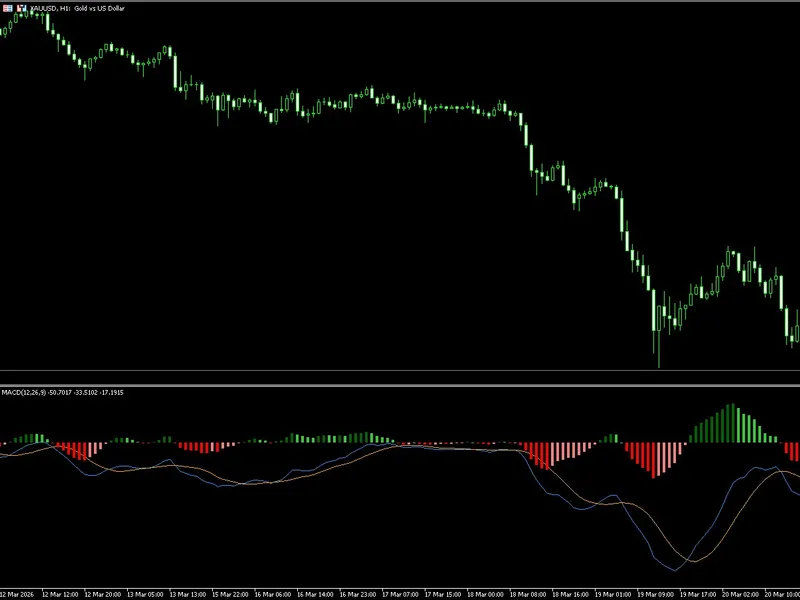
Fig. 1. Trendless OS - Drawing type = Line
Fig. 2. Trendless OS - Drawing type = Histogram