Stochastic Oscillator Blau TS Stochastic
This is a powerful addition to your MetaTrader 5 toolkit designed to optimize market analysis and performance. This technical indicator acts as a specialized analysis tool designed to visualize market data. It helps traders identify emerging trends, momentum shifts, and key support or resistance levels by plotting statistical calculations directly onto price charts.
How to Setup and Use Stochastic Oscillator Blau TS Stochastic
1. Installation: Place your file in the MQL/Indicators folder via "Open Data Folder" and restart your terminal.
2. Loading: Find the indicator in the Navigator, drag it onto your chart, and configure the input parameters in the popup window.
3. Customization: Press Ctrl+I to open the indicator list, select your tool, and click "Properties" to change colors, levels, or visual styles.
4. Updating: Replace the old file in the Indicators folder with the new version and restart the platform to apply changes.
Frequently Asked Questions
Q: Why is my indicator not showing? A: Verify the file is in the MQL/Indicators folder, or try right-clicking the "Indicators" tree in the Navigator and clicking "Refresh."
Q: Do custom indicators slow down the platform? A: Too many complex indicators can impact performance; remove unused ones via the "Indicator List" (Ctrl+I).
Q: Can I use MT4 indicators on MT5? A: No, MQL4 and MQL5 are distinct languages; ensure the indicator is compiled specifically for your platform version.
Description & Settings
Stochastic Oscillator is based on by William Blau (see ).
WilliamBlau.mqh must be placed in
terminal_data_folder
\MQL5\Include\
Blau_TS_Stochastic.mq5 must be placed in
terminal_data_folder
\MQL5\Indicators\
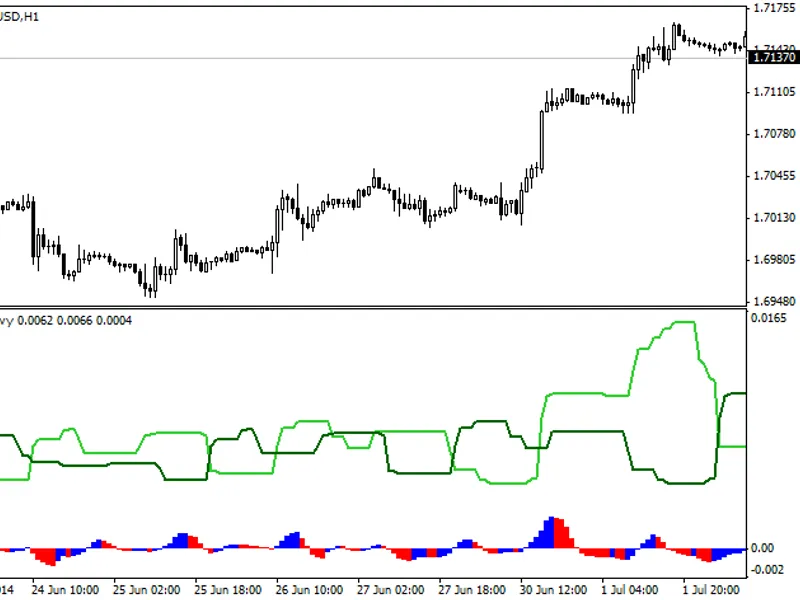
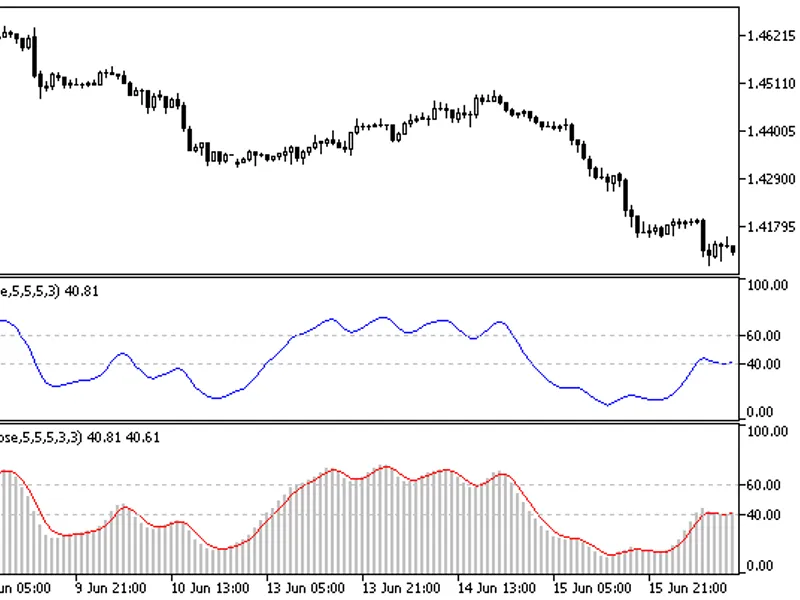
Stochastic Oscillator by William Blau
Calculation:
Stochastic Oscillator is defined as follows:
Signal line is calculated using the smoothing:
where:
TS_Stochastic() - Fast Stochastic, %k - Stochastic Index TStochI(price,q,r,s,u);
SignalLine() - Slow Stochastic (Signal Line), %d with period ul, applied to Fast Stochastic (%k);
ul - EMA smoothing period of a Signal Line.
Input parameters:
graphic plot #0 - Fast Stochastic (Stochastic Index), %k:
q - period of Stochastic (by default q=5);
r - period of the 1st EMA, applied to Stochastic (by default r=20);
s - period of the 2nd EMA smoothing, applied to result of the 1st smoothing (by default s=5);
u - period of the 3rd EMA smoothing, applied to result of the 2nd smoothing (by default u=3);
graphic plot #1 - Slow Stochastic (Signal Line), %d:
ul - period of EMA smoothing (signal line), applied to Fast Stochastic (by default ul=3);
AppliedPrice - (by default AppliedPrice=PRICE_CLOSE).
Note:
q>0;
r>0, s>0, u>0.If r, s or u =1, smoothing is not used;
ul>0. If ul=1, the oscillator and signal lines are the same;
Min. rates =(q-1+r+s+u-3+1).