Gann Swing
This professional-grade solution for MetaTrader 5 helps traders achieve greater efficiency in their daily workflow. This technical indicator acts as a specialized analysis tool designed to visualize market data. It helps traders identify emerging trends, momentum shifts, and key support or resistance levels by plotting statistical calculations directly onto price charts.
How to Setup and Use Gann Swing
1. Installation: Place your file in the MQL/Indicators folder via "Open Data Folder" and restart your terminal.
2. Loading: Find the indicator in the Navigator, drag it onto your chart, and configure the input parameters in the popup window.
3. Customization: Press Ctrl+I to open the indicator list, select your tool, and click "Properties" to change colors, levels, or visual styles.
4. Updating: Replace the old file in the Indicators folder with the new version and restart the platform to apply changes.
Frequently Asked Questions
Q: Why is my indicator not showing? A: Verify the file is in the MQL/Indicators folder, or try right-clicking the "Indicators" tree in the Navigator and clicking "Refresh."
Q: Do custom indicators slow down the platform? A: Too many complex indicators can impact performance; remove unused ones via the "Indicator List" (Ctrl+I).
Q: Can I use MT4 indicators on MT5? A: No, MQL4 and MQL5 are distinct languages; ensure the indicator is compiled specifically for your platform version.
Description & Settings
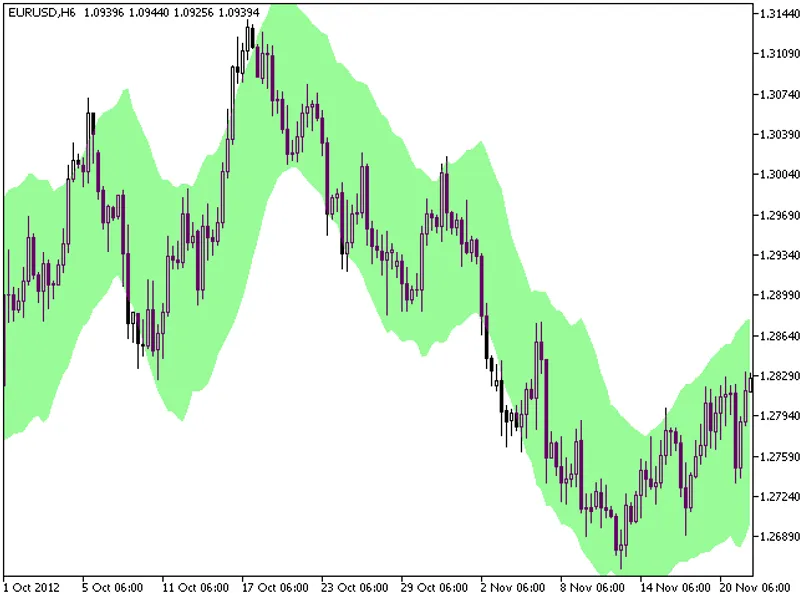
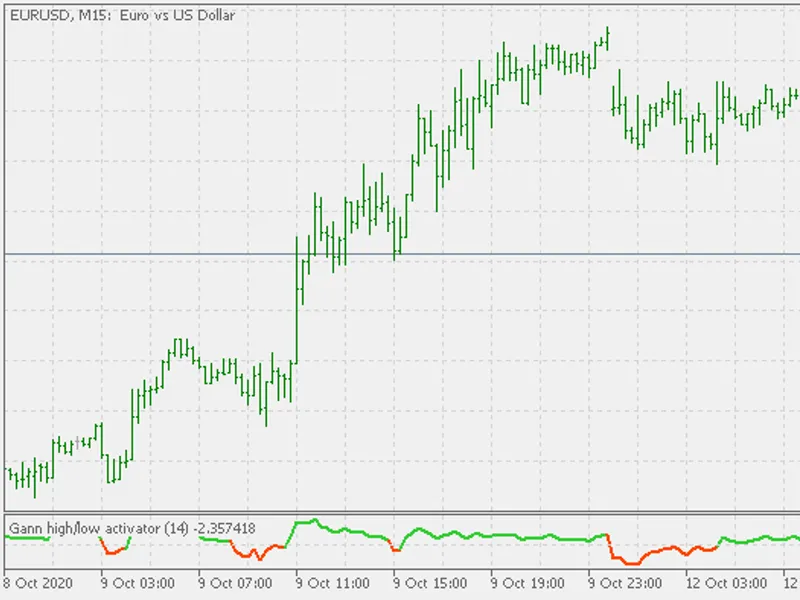
Gann Swing is similar to ZigZag. It allows detecting market patterns and is calculated using the Gann trend detection method.
The indicator has no input parameters.
Two consecutive Higher High of the last two candles indicate Upswing.
Two consecutive lowering Lows of the last two candles indicate a downswing.
If the next bar has a higher high and lower low (or same low) when compared to the previous bar, then the indicator line goes up connecting the high of the next bar.
If the next bar has a lower or equal High and a lower Low as compared to the preceding bar, then the indicator line goes lower, joining the Low of the next bar.
If the next bar is an inside bar (lower high and higher low), the bar is skipped before the next one appears.
If the next bar is an external bar (a higher High and a lower Low), then the indicator line will connect to the High of the external bar, provided that the bar following the external bar is lower, OR the indicator line will connect to the Low of the external bar, provided that the bar following the external bar is higher.
If the price has fixed above the previous peak, this means the likely start of an uptrend.
If the price has fixed below the previous bottom, it means that a downtrend is likely to start.