Master Tools
This professional-grade solution for MetaTrader 4 helps traders achieve greater efficiency in their daily workflow. This technical indicator acts as a specialized analysis tool designed to visualize market data. It helps traders identify emerging trends, momentum shifts, and key support or resistance levels by plotting statistical calculations directly onto price charts.
How to Setup and Use Master Tools
1. Installation: Place your file in the MQL/Indicators folder via "Open Data Folder" and restart your terminal.
2. Loading: Find the indicator in the Navigator, drag it onto your chart, and configure the input parameters in the popup window.
3. Customization: Press Ctrl+I to open the indicator list, select your tool, and click "Properties" to change colors, levels, or visual styles.
4. Updating: Replace the old file in the Indicators folder with the new version and restart the platform to apply changes.
Frequently Asked Questions
Q: Why is my indicator not showing? A: Verify the file is in the MQL/Indicators folder, or try right-clicking the "Indicators" tree in the Navigator and clicking "Refresh."
Q: Do custom indicators slow down the platform? A: Too many complex indicators can impact performance; remove unused ones via the "Indicator List" (Ctrl+I).
Q: Can I use MT4 indicators on MT5? A: No, MQL4 and MQL5 are distinct languages; ensure the indicator is compiled specifically for your platform version.
Description & Settings
Changelog:
v1.08:
After a long time of absence :)
Bug correction and compilation.
v1.07:
Now SL / TP choose for each chart and not for all.
For the grid, now you can choose a different grid gap for each chart.
New option, have sound alert when the price is close to your TP or SL, you can choose the number of pips before ringing ** DON'T FORGET TO INPUT THE NEW SOUND FROM THE SOUNDS.ZIP ** its not activated by default.
Add more information, in your Buy/Sell line and the TP and SL.
And made some few correction.
Trendline have now label information like the support and resistance line.
v1.06:
Correction on master_info_ea.mq4 less bug, hopefully no more bugs :).
master_info_ea.mq4 better information when the order is rejected by the broker.
In the option panel you can choose between Classic Pivot Point or Fibonacci Pivot Point and now you can see the name of the Pivot line S1 S2...
In the option panel you have a button to make a backup of your Resistance/Support line.
In the option panel you can choose the default SL and TP.
The Grid function, the line where the price is have a different color.
Lot of correction of micro bugs.
Correction on chart with only 1 or 0 digit.
v1.05:
The Support and Resistance Lines are now automatically saved in a file ".../MQL4/files/supportresistance-EURUSD.csv". Each Symbol has its own file.
If you open a new chart and open a Symbol, if a file exists, you will have the Support and Resistance Lines automatically, you can give your file to others if you want.
A Backup Button is created for this line, it will create a file with the current date, so if you make a bad manipulation, you will not lose your precious lines!
Correction of a minor bug.
v1.04:
to SELL/BUY/TP/SL real order, if you have multiple orders on the same chart you will not move the wrong TP ou SL and you will see the TP value.
v1.03:
Added a new window option, to easily change parameters, press "O" to open the options window.
by background color, you can choose the Pip, the variation of color, and see the price.
.
.
v1.02:
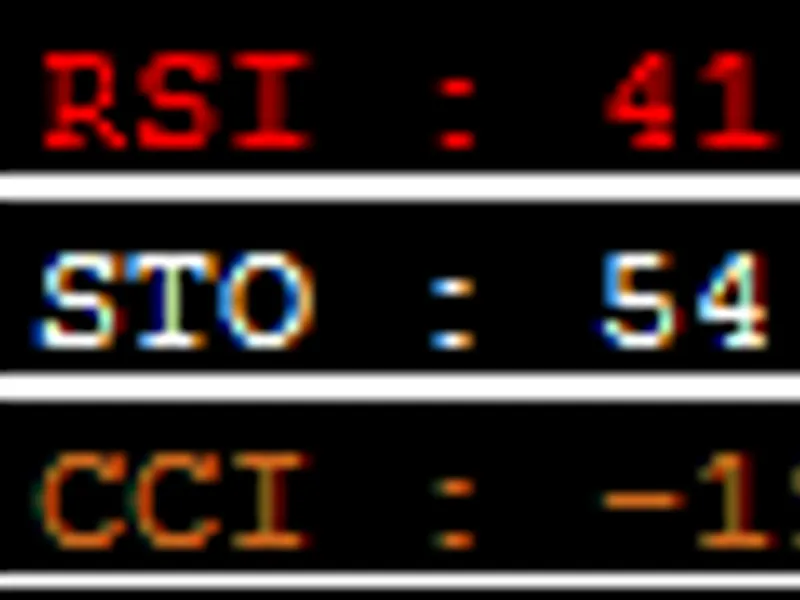
added indicators summary (RSI/STOCHASTIC/CCI/MACD/MOMENTUM) and moving average summary simple/exponential at 5/10/20/50/100/200 period; MA compute the Sell and Buy indication of the 12 MA, 6 moving average simple (5/10/20/50/100/200) period and the 6 moving average exponential.This part is optional, use "Show indicator information" to show or hide. Red is sell, brown is oversell, white is neutral, green is buy, dark green is overbuy.
on mouse over the timeframe, you can see the indicators summary change to the timeframe chosen;
added SL button on/off in Money Management Tool.
v1.01:
correction on PipClick (int to double);
correction on PipClick use ASK and BID correctly;
on mouse over TimeFrame button show ATR/RSI/BULL/BEAR of the timeframe;
correction on interface button status;
correction on the indicator and the EA, pending order correction (don't forget to update the EA).
Until now I realized 5 indicators and I decided to bring 4 of them together in a single tool. The goal was to unify the interface for each tool because there was a floating window and use the Lot size for each.
: Allows you to do a real money management work and open orders.
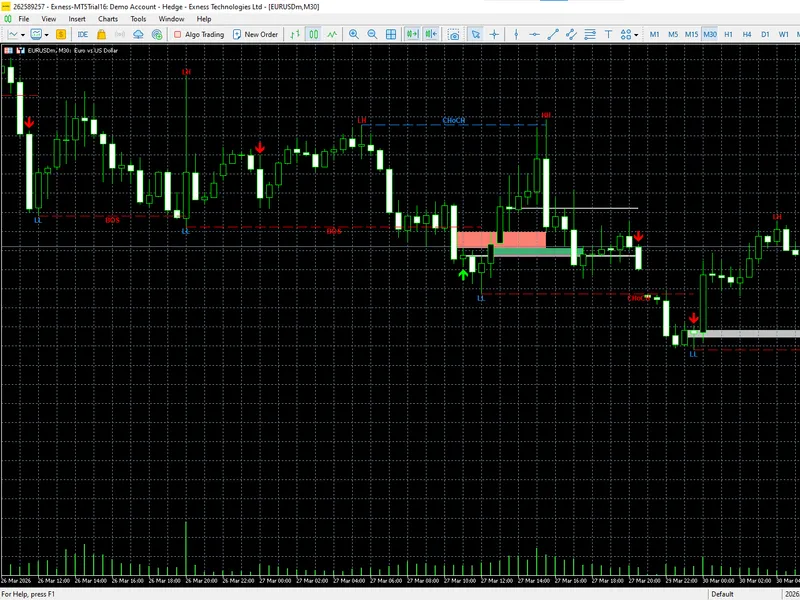
: Gives you a lot of information to help you decide what to do.
: Helps you work with Support and Resistance levels.
: Change timeframe easily.
The
Master_Info_EA.mq4
is optional, but if you want to open orders in the , you need to download it.
The file
sounds.zip
is optional, it contains sounds for , if you want to use it, decompress in your MetaTrader 4 "Sounds" directory. If you create cool sounds, share them!
What we lose and what we gain over the original indicator:
. We just lose the ratio button to move quickly the TP line at a fixed ratio. But the interface is now smaller.
. I deleted a lot of information, but I don't not use it anymore, I just kept the most useful. If you need some more, just tell me, I have some more room!
. This one gained new option, the original indicator had no interface, so it's better.
. No changes, and it is this indicator which inspired me to create Master Tools.
Explanation tool per tool:
Description:
Provides information that helps you make a better decision.
Basic interface:
Always at the bottom and displays useful information.
Hide/Show:
The interface can be hidden, just hit "H".
Lot Size:
You can change the Lot size, for that use the + and - buttons, or use the shortcut "P" and "M". The Pip value will be recalculated. The Lot size will be used in all other functions of the other tool.
Click mouse on the chart:
If you click on the chart, you can have information of the mouse position. The price you click, the Pip separating the actual price and the mouse position, the value in your currency. It is really useful to know before taking a trade the potential of it.
The Price & the date:
By moving the mouse on the chart you can see the price and the date, the price information is useful for the other tool.
Swap Buy & Swap Sell:
If you need to take a long position you can see the swap provided by your broker.
Countdown:
The countdown to the next candle.
Spread:
Information of the Spread in pip and in your currency.
Description:
This tool will help you create Support and Resistance lines — with one keystroke you can create the line with the color, shape and width you want. Each line provides information on the pip left from price, the same information in your currency. The tool changes the color of the line automatically, allowing to easily see what is going on.
You have at your disposal 2 kinds of line with 2 different shortcuts different, by default A and Q. You can choose all the line options for each.
The indicator will alert you when the price crosses the line. You can choose to activate smartphone notification when you are away. I had a new option to the original tool, you can choose the sound of the alert. You have 6 set of sounds, for each set there are 2 sounds — one for transforming a support into a resistance and the second for resistance to support, so you can take a coffee or read your news and you will not miss important information. (If you use sound, you should cut the default Alert sound of MetaTrader 4.)
Why two sorts of lines: I use the first line for resistance and support and use the second line like an alarm. Sometimes pending order can be tricky to put, so when the price reaches the second line, I can take a decision and not miss the window.
But you can use it differently: the first for big resistance and support and the second for small resistance and support.
The trend line can be handled by the script if you want (it's "yes" by default, don't be surprised).
Interface:
When you create a line, a new option appears in the interface. For each line you can activate the Alarm "A" button, you can show/hide the line, and you can change the sound. Personally, I use three different currencies and therefore I set a different sound for each. So I know what is happening even if I do not look at the screen.
Hide/Show:
Hiding just one kind of line.
Deleting:
You can delete lines just by typing X key on the keyboard. Each time you use X, you delete a new line.
Description:
By hitting "B" for Buy or "S" for Sell, you can see 3 lines: the Buy/Sell line (at the mouse position), the Take Profit line and the Stop Loss line. You can move them as you like and directly see the ratio, the SL value, the TP value, the risk. You can show/hide the TP, you can follow the price if you want to put a direct Buy/Sell, otherwise, you will place a pending order. You can change the risk and the Lot size to see what is going on. When you move line or Risk the lot size will change to the optimal size. If you activate the autotrade and put the Master_Tools_EA.mq4, then the button to order will appear.
Description:
Simple buttons to change the timeframe directly on the chart. You can change the zoom too. Changing the timeframe of the wrong chart is now over!
Grid
Description:
you can see a grid in the background of the chart, you choose the pip height, you can choose the color intensity, and see the price or not.
DailyOpen
Description:
Draw the line of the close price of the day before.
PivotPoint
Description:
Draw the simple Pivot Point R4 to S4.
Sell/Buy/TP/SL Label
Description:
Add information on the order line, no more mixed up by moving the wrong TP line.
Parameters: