Simple ZZ Consolidation Zones
This professional-grade solution for MetaTrader 5 helps traders achieve greater efficiency in their daily workflow. This technical indicator acts as a specialized analysis tool designed to visualize market data. It helps traders identify emerging trends, momentum shifts, and key support or resistance levels by plotting statistical calculations directly onto price charts.
How to Setup and Use Simple ZZ Consolidation Zones
1. Installation: Place your file in the MQL/Indicators folder via "Open Data Folder" and restart your terminal.
2. Loading: Find the indicator in the Navigator, drag it onto your chart, and configure the input parameters in the popup window.
3. Customization: Press Ctrl+I to open the indicator list, select your tool, and click "Properties" to change colors, levels, or visual styles.
4. Updating: Replace the old file in the Indicators folder with the new version and restart the platform to apply changes.
Frequently Asked Questions
Q: Why is my indicator not showing? A: Verify the file is in the MQL/Indicators folder, or try right-clicking the "Indicators" tree in the Navigator and clicking "Refresh."
Q: Do custom indicators slow down the platform? A: Too many complex indicators can impact performance; remove unused ones via the "Indicator List" (Ctrl+I).
Q: Can I use MT4 indicators on MT5? A: No, MQL4 and MQL5 are distinct languages; ensure the indicator is compiled specifically for your platform version.
Description & Settings
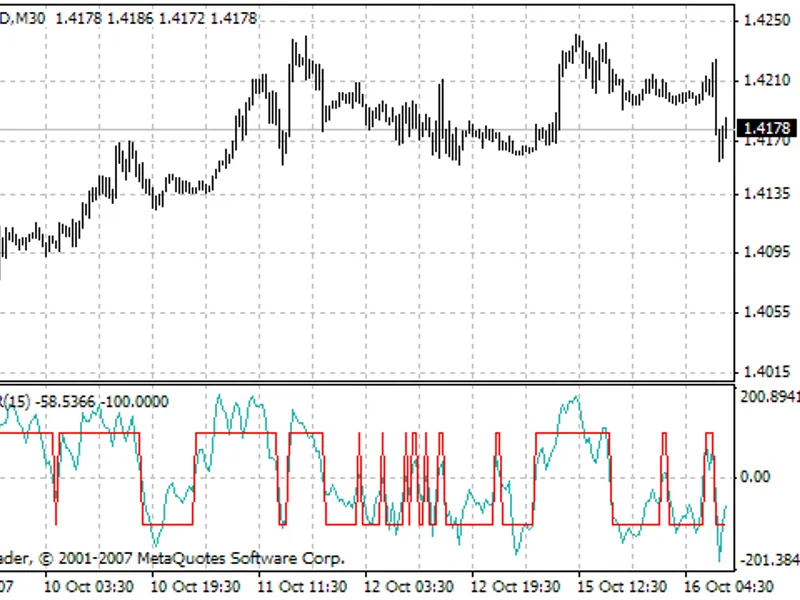
More experiments with the Simple ZigZag indicator. A small upgrade allows the indicator to find and mark the price consolidation areas with colored rectangles.
The Simple ZigZag indicator is the development of an idea of automated visualization of technical analysis. We have started with a simple indicator that plots local Highs and Lows on a chart. Our task now is to learn to recognize different patterns of technical analysis using the above indicator.
The proposed indicator searches for flat consolidation zones on a price chart.
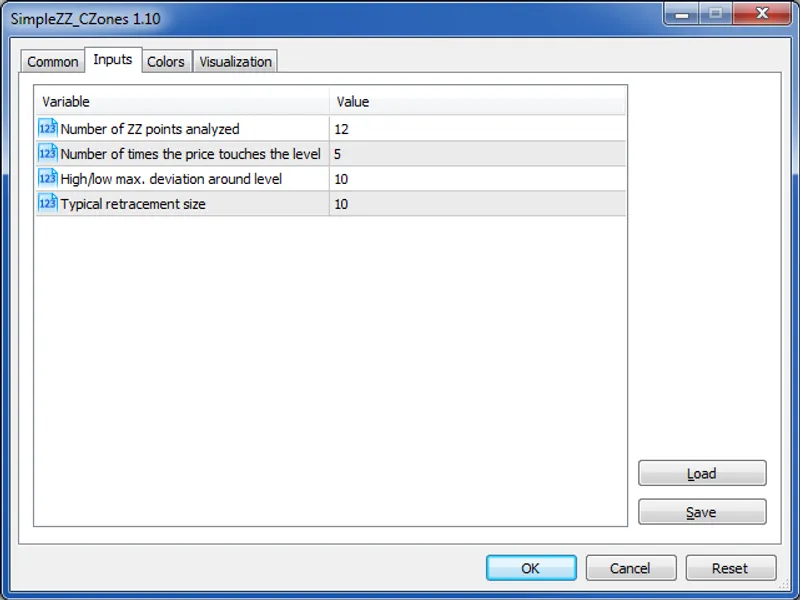
The number of highs/lows required for constructing a zone, the total number of analyzed zigzag points, and the accuracy of matching of extrema are defined by the three parameters of the indicator:
Number of times the price touches the level.
Number of ZZ points analyzed.
High/low max. deviation around level.
The fourth parameter - Typical retracement size - is inherited from the parent indicator ().
The areas where several highs make up a line in the upper part of the zone are marked in red; the areas where several lows make up a line in the lower part of the zone are marked in blue. As for now, the indicator cannot be built into an Expert Advisor, because it doesn't have appropriate buffers for the area borders (expected later). We will further continue to complicate the recognized patters, and will adapt the indicator for use in automated trading systems.