Simple Decycler
This software component for MetaTrader 5 is built to enhance the capabilities of your trading environment. This technical indicator acts as a specialized analysis tool designed to visualize market data. It helps traders identify emerging trends, momentum shifts, and key support or resistance levels by plotting statistical calculations directly onto price charts.
How to Setup and Use Simple Decycler
1. Installation: Place your file in the MQL/Indicators folder via "Open Data Folder" and restart your terminal.
2. Loading: Find the indicator in the Navigator, drag it onto your chart, and configure the input parameters in the popup window.
3. Customization: Press Ctrl+I to open the indicator list, select your tool, and click "Properties" to change colors, levels, or visual styles.
4. Updating: Replace the old file in the Indicators folder with the new version and restart the platform to apply changes.
Frequently Asked Questions
Q: Why is my indicator not showing? A: Verify the file is in the MQL/Indicators folder, or try right-clicking the "Indicators" tree in the Navigator and clicking "Refresh."
Q: Do custom indicators slow down the platform? A: Too many complex indicators can impact performance; remove unused ones via the "Indicator List" (Ctrl+I).
Q: Can I use MT4 indicators on MT5? A: No, MQL4 and MQL5 are distinct languages; ensure the indicator is compiled specifically for your platform version.
Description & Settings
Simple Decycler indicator is created based on "Decyclers" article by John F. Ehlers in the magazine "Technical Analysis of Stocks & Commodities" (September 2015).
It has two configurable parameters:
HP period
- high-frequency filter period
Applied price
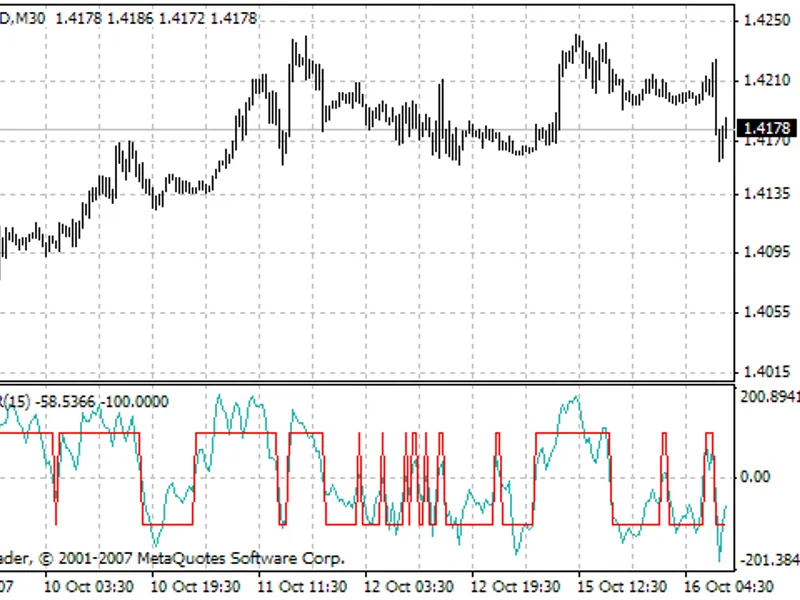
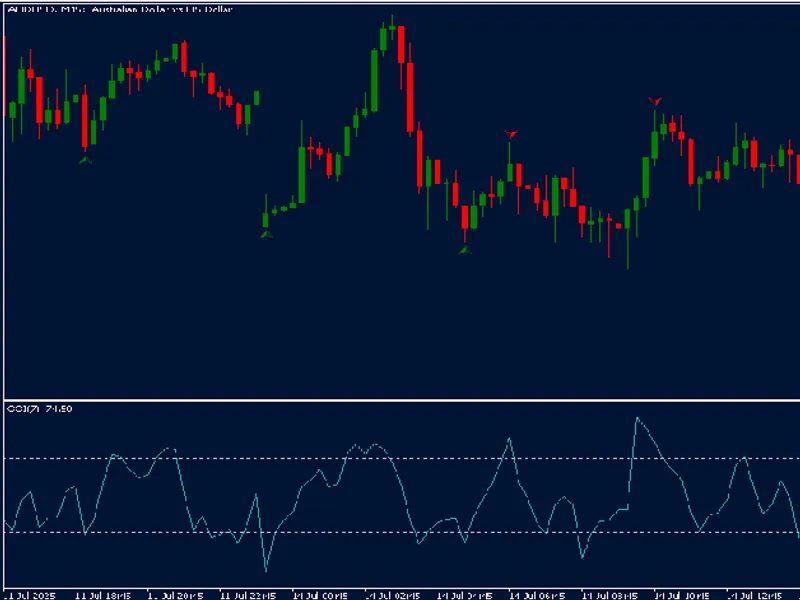
The indicator sorts price high-frequency components discarding low-frequency direction components and quickly responding to the market situation. The indicator draws three lines. If a stock price is above the upper line, then it is considered to be in an uptrend, if the price is below the lower line, then it is considered to be in a downtrend. If the price is between these lines, the stock is not in a trend.