RS T L
This professional-grade solution for MetaTrader 5 helps traders achieve greater efficiency in their daily workflow. This technical indicator acts as a specialized analysis tool designed to visualize market data. It helps traders identify emerging trends, momentum shifts, and key support or resistance levels by plotting statistical calculations directly onto price charts.
How to Setup and Use RS T L
1. Installation: Place your file in the MQL/Indicators folder via "Open Data Folder" and restart your terminal.
2. Loading: Find the indicator in the Navigator, drag it onto your chart, and configure the input parameters in the popup window.
3. Customization: Press Ctrl+I to open the indicator list, select your tool, and click "Properties" to change colors, levels, or visual styles.
4. Updating: Replace the old file in the Indicators folder with the new version and restart the platform to apply changes.
Frequently Asked Questions
Q: Why is my indicator not showing? A: Verify the file is in the MQL/Indicators folder, or try right-clicking the "Indicators" tree in the Navigator and clicking "Refresh."
Q: Do custom indicators slow down the platform? A: Too many complex indicators can impact performance; remove unused ones via the "Indicator List" (Ctrl+I).
Q: Can I use MT4 indicators on MT5? A: No, MQL4 and MQL5 are distinct languages; ensure the indicator is compiled specifically for your platform version.
Description & Settings
Vladimir Kravchuk
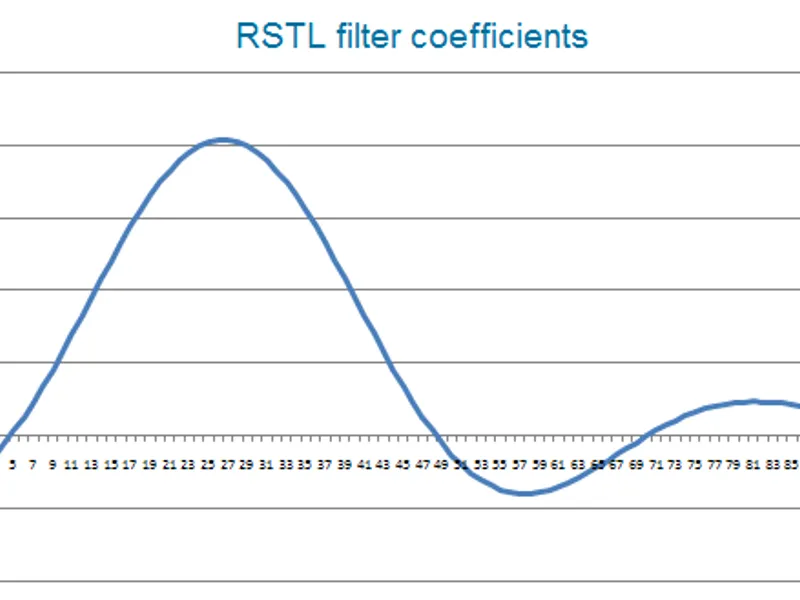
RSTL (Reference Slow Trend Line) is a response "slow" trend line. It is a response of FLF-1 and FLF-2 digital filters to the input discrete sequence. The filters are set with the delay equal to the Nyquist TNi range.
RSTL reference line is an equivalent of simple moving "averages" from the viewpoint of their delay relative to the current prices. Mentioned similarity would have been complete, in case we use an impulse parameter having 1/N weights that corresponds to the procedure of the dotted moving smoothing instead of the complicated FLF impulse parameters.