RS I Price Action Breakout Indicator
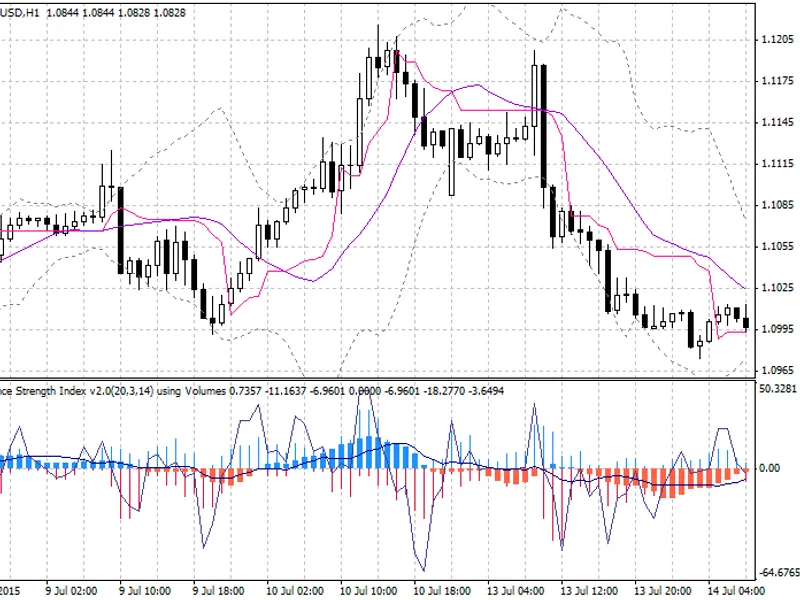
This tool for MetaTrader 5 is specifically engineered to streamline your trading operations. This technical indicator acts as a specialized analysis tool designed to visualize market data. It helps traders identify emerging trends, momentum shifts, and key support or resistance levels by plotting statistical calculations directly onto price charts.
How to Setup and Use RS I Price Action Breakout Indicator
1. Installation: Place your file in the MQL/Indicators folder via "Open Data Folder" and restart your terminal.
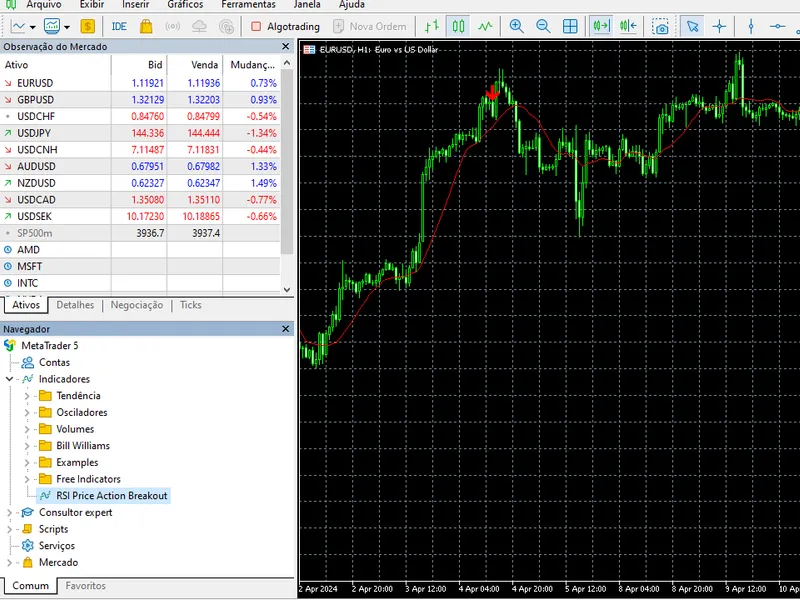
2. Loading: Find the indicator in the Navigator, drag it onto your chart, and configure the input parameters in the popup window.
3. Customization: Press Ctrl+I to open the indicator list, select your tool, and click "Properties" to change colors, levels, or visual styles.
4. Updating: Replace the old file in the Indicators folder with the new version and restart the platform to apply changes.
Frequently Asked Questions
Q: Why is my indicator not showing? A: Verify the file is in the MQL/Indicators folder, or try right-clicking the "Indicators" tree in the Navigator and clicking "Refresh."
Q: Do custom indicators slow down the platform? A: Too many complex indicators can impact performance; remove unused ones via the "Indicator List" (Ctrl+I).
Q: Can I use MT4 indicators on MT5? A: No, MQL4 and MQL5 are distinct languages; ensure the indicator is compiled specifically for your platform version.
Description & Settings
Engineering Logic
The algorithm operates on a strict two-step validation process: 1. Condition A (Setup): The RSI (Relative Strength Index) must breach the defined thresholds (Default: 70 for Overbought, 30 for Oversold). This indicates potential exhaustion. 2. Condition B (Trigger): A reversal candlestick pattern must occur. - For Sells: The price must close below the previous candle's low (Engulfing structure). - For Buys: The price must close above the previous candle's high. Key Features - Zero-Repaint: Arrows are plotted only after the candle closes. - Buffer Architecture: Optimised for iCustom calls within Expert Advisors. - Visual Efficiency: Clean chart overlay with distinct buy/sell signals. Parameters - InpRSIPeriod (14): Period for the Relative Strength Index calculation. - InpRSIOverbought (70): Level to monitor for selling opportunities. - InpRSIOversold (30): Level to monitor for buying opportunities. Usage Recommendations
This indicator is best used as a filter for scalping strategies on M1/M5 timeframes or as a confirmation signal for Swing Trading on H1.