Relative Momentum Index (RM I)
This is a powerful addition to your MetaTrader 5 toolkit designed to optimize market analysis and performance. This technical indicator acts as a specialized analysis tool designed to visualize market data. It helps traders identify emerging trends, momentum shifts, and key support or resistance levels by plotting statistical calculations directly onto price charts.
How to Setup and Use Relative Momentum Index (RM I)
1. Installation: Place your file in the MQL/Indicators folder via "Open Data Folder" and restart your terminal.
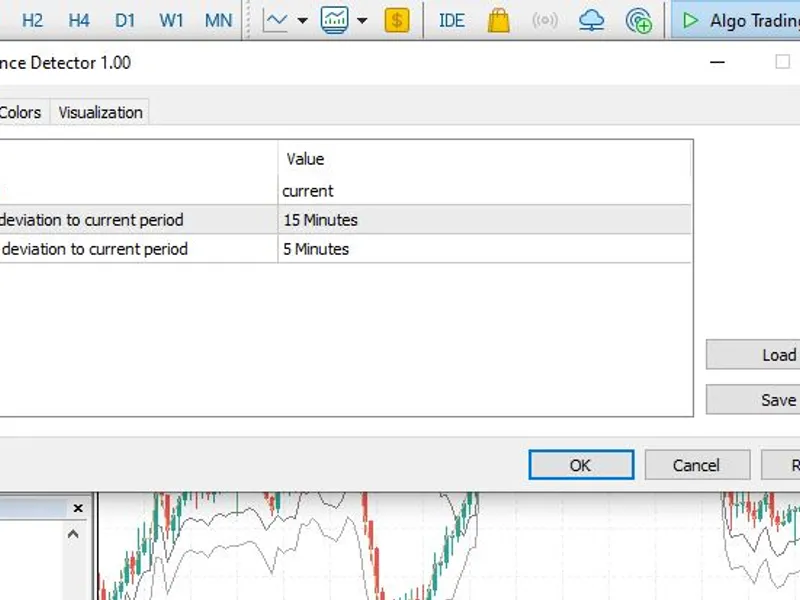
2. Loading: Find the indicator in the Navigator, drag it onto your chart, and configure the input parameters in the popup window.
3. Customization: Press Ctrl+I to open the indicator list, select your tool, and click "Properties" to change colors, levels, or visual styles.
4. Updating: Replace the old file in the Indicators folder with the new version and restart the platform to apply changes.
Frequently Asked Questions
Q: Why is my indicator not showing? A: Verify the file is in the MQL/Indicators folder, or try right-clicking the "Indicators" tree in the Navigator and clicking "Refresh."
Q: Do custom indicators slow down the platform? A: Too many complex indicators can impact performance; remove unused ones via the "Indicator List" (Ctrl+I).
Q: Can I use MT4 indicators on MT5? A: No, MQL4 and MQL5 are distinct languages; ensure the indicator is compiled specifically for your platform version.
Description & Settings
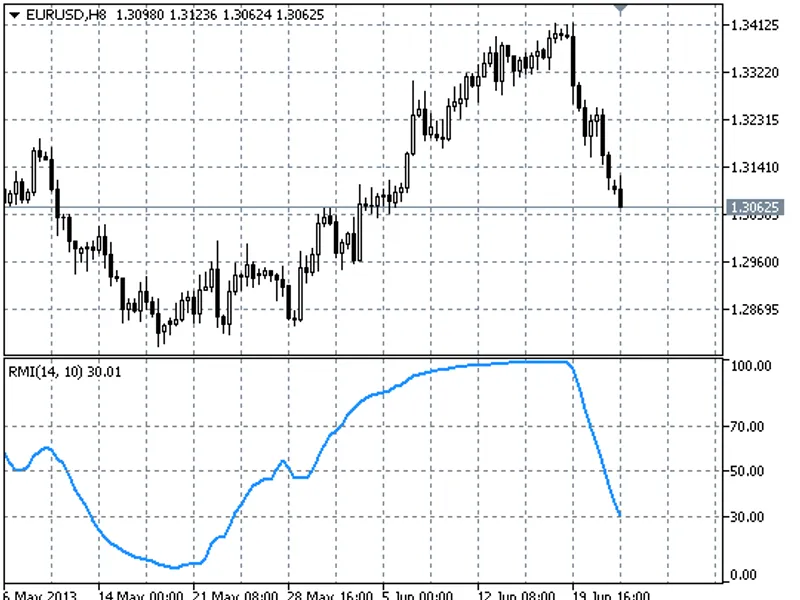
The difference from RSI is that it uses price change for a specified period (i.e. the momentum) instead of the price changes of two adjacent bars. The rest of the calculations are similar to RSI. The indicator was developed by Roger Altman and was first published in February 1993 in the Technical Analysis of Stocks & Commodities magazine.
Parameters:
RMI Period
- the period of RMI.
Momentum Period
- the period of momentum (with the value 1 the indicator is identical to RSI).
Interpretation of the signal is the same as that of the relative strength index:
The tops and bottoms of the indicator are a little ahead of the formation of local price maximums and minimums.
Graphical patterns (head and shoulders, etc.) that are not easy to recognize on price charts.
Divergence.