Range Ratio
This professional-grade solution for MetaTrader 5 helps traders achieve greater efficiency in their daily workflow. This technical indicator acts as a specialized analysis tool designed to visualize market data. It helps traders identify emerging trends, momentum shifts, and key support or resistance levels by plotting statistical calculations directly onto price charts.
How to Setup and Use Range Ratio
1. Installation: Place your file in the MQL/Indicators folder via "Open Data Folder" and restart your terminal.
2. Loading: Find the indicator in the Navigator, drag it onto your chart, and configure the input parameters in the popup window.
3. Customization: Press Ctrl+I to open the indicator list, select your tool, and click "Properties" to change colors, levels, or visual styles.
4. Updating: Replace the old file in the Indicators folder with the new version and restart the platform to apply changes.
Frequently Asked Questions
Q: Why is my indicator not showing? A: Verify the file is in the MQL/Indicators folder, or try right-clicking the "Indicators" tree in the Navigator and clicking "Refresh."
Q: Do custom indicators slow down the platform? A: Too many complex indicators can impact performance; remove unused ones via the "Indicator List" (Ctrl+I).
Q: Can I use MT4 indicators on MT5? A: No, MQL4 and MQL5 are distinct languages; ensure the indicator is compiled specifically for your platform version.
Description & Settings
It is based on a simple idea that with a sharp one-directional movement, the distance between the high and the low of the selected period should tend to the total of bar ranges of that period. The indicator is the ratio of one value to the second one, that is:
RangeRatio = (max high - min low) / Sum(high[i] - low[i])
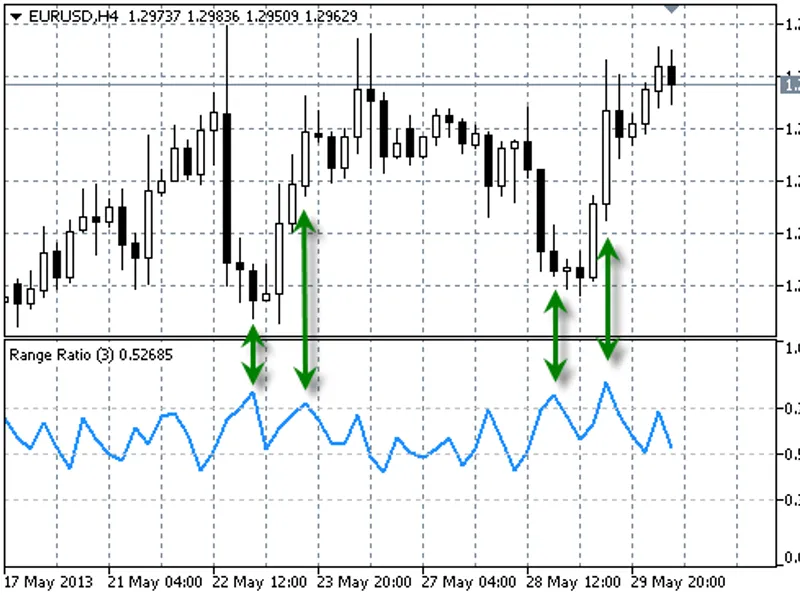
The indicator is designed for higher timeframes (H4 and higher), works well with periods of 3-5 bars. Values greater than 0.7 indicate that the movement does not have potential, so there will be either consolidation, rollback or reversal.
Range Ratio with the period 3 on EURUSD H4:
Tips:
I do not advise to use the indicator with a period of more than 5, as it is designed for short-term systems, so the greater the value of the period - the less reliable is the signal.
As seen in the figure above, the bars that are indicated by the arrows, are quite good exit points (important: I mean exit at the close of the candlestick).
Example of use as a filter: if you receive a buy signal on the timeframe H1, but on the daily chart in an uptrend the value of RangeRatio is greater than 0.7 - it is recommended to ignore the signal. In other words, intending to enter the market, check the value of RangeRatio on a higher timeframe.