Std Score
This professional-grade solution for MetaTrader 4 helps traders achieve greater efficiency in their daily workflow. This technical indicator acts as a specialized analysis tool designed to visualize market data. It helps traders identify emerging trends, momentum shifts, and key support or resistance levels by plotting statistical calculations directly onto price charts.
How to Setup and Use Std Score
1. Installation: Place your file in the MQL/Indicators folder via "Open Data Folder" and restart your terminal.
2. Loading: Find the indicator in the Navigator, drag it onto your chart, and configure the input parameters in the popup window.
3. Customization: Press Ctrl+I to open the indicator list, select your tool, and click "Properties" to change colors, levels, or visual styles.
4. Updating: Replace the old file in the Indicators folder with the new version and restart the platform to apply changes.
Frequently Asked Questions
Q: Why is my indicator not showing? A: Verify the file is in the MQL/Indicators folder, or try right-clicking the "Indicators" tree in the Navigator and clicking "Refresh."
Q: Do custom indicators slow down the platform? A: Too many complex indicators can impact performance; remove unused ones via the "Indicator List" (Ctrl+I).
Q: Can I use MT4 indicators on MT5? A: No, MQL4 and MQL5 are distinct languages; ensure the indicator is compiled specifically for your platform version.
Description & Settings
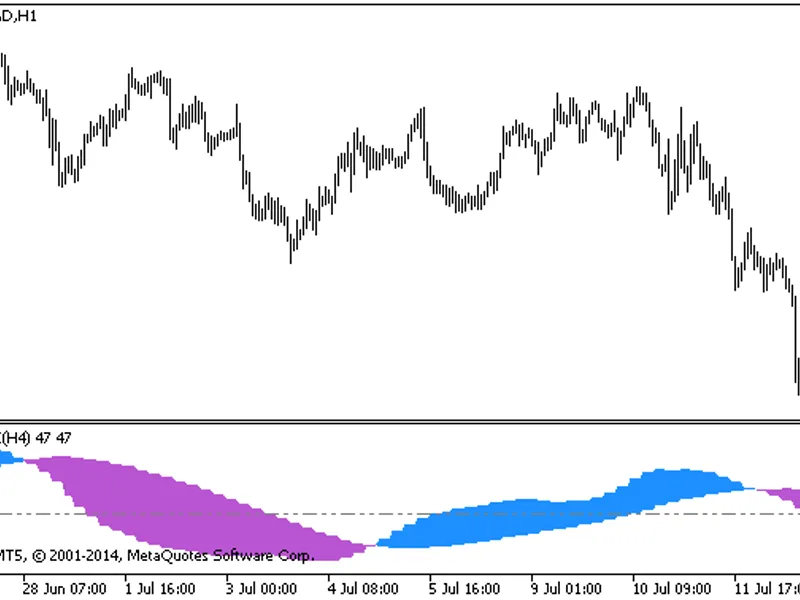
An oscillator that duplicates the chart of a selected asset in a separate window in three ways: line, bars and candles. This is essentially an indicator Bollinger bands, displayed in a separate window. In my opinion, it will be useful for beginners as a way to look at various technical signals from a different angle. This indicator helped me in an adviser for filtering unfavorable moments for trades.
Calculation of a standard assessment and its conclusion in the form of candles.
Formula:
μ - moving average
σ - is the standard deviation
Important features:
the last candle (current candle) can be indicator redrawn strongly, especially at the beginning, this is a feature of the calculation formula
сhecking the accessibility of history is not carried out, which is especially true when using a symbol other than the current
Parameter Description
Ways of interpretation:
1. When you hold a trade and it is in the positive zone, moving the indicator values from 2 to 4 indicates a likely local rebound soon, so you should think about fixing a position if your trade is designed for short movements.
2. Confirmation signalas of breakout trading ranges, as well as the provision of early signals for transactions.
If you find more interesting examples of how to work with this indicator, write to me, I will be happy!