Pivot Lines Time Zone
This tool for MetaTrader 5 is specifically engineered to streamline your trading operations. This technical indicator acts as a specialized analysis tool designed to visualize market data. It helps traders identify emerging trends, momentum shifts, and key support or resistance levels by plotting statistical calculations directly onto price charts.
How to Setup and Use Pivot Lines Time Zone
1. Installation: Place your file in the MQL/Indicators folder via "Open Data Folder" and restart your terminal.
2. Loading: Find the indicator in the Navigator, drag it onto your chart, and configure the input parameters in the popup window.
3. Customization: Press Ctrl+I to open the indicator list, select your tool, and click "Properties" to change colors, levels, or visual styles.
4. Updating: Replace the old file in the Indicators folder with the new version and restart the platform to apply changes.
Frequently Asked Questions
Q: Why is my indicator not showing? A: Verify the file is in the MQL/Indicators folder, or try right-clicking the "Indicators" tree in the Navigator and clicking "Refresh."
Q: Do custom indicators slow down the platform? A: Too many complex indicators can impact performance; remove unused ones via the "Indicator List" (Ctrl+I).
Q: Can I use MT4 indicators on MT5? A: No, MQL4 and MQL5 are distinct languages; ensure the indicator is compiled specifically for your platform version.
Description & Settings
How it works
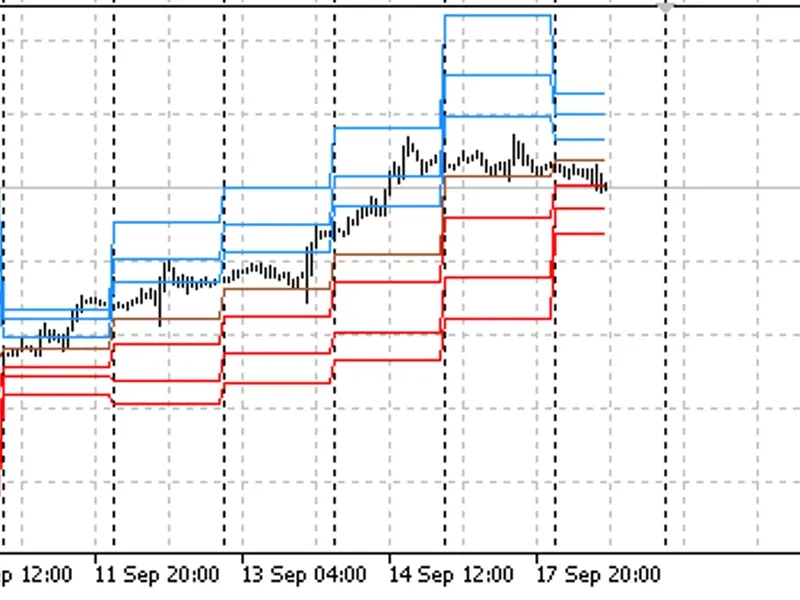
The indicator draws the Pivot levels, the Pivot sublevels and the Camarilla levels.
Levels can be displayed by indicator buffers (by the whole history) and/or only current levels by horizontal lines.
Drawing levels using the indicator buffers.
Drawing levels using the horizontal lines.
Parameters
DayStartHour - Hour of day start.
DayStartMinute - Minutes of day start.
PivotsBuffers - Draw the Pivot levels using the indicator buffers.
MidpivotsBuffers - Draw the Pivot sublevels using the indicator buffers.
CamarillaBuffers - Draw the Camarilla levels using the indicator buffers.
PivotsLines - Draw the current Pivot levels using the horizontal lines.
MidpivotsLines - Draw the current Pivot sublevels using the horizontal lines.
CamarillaLines - Draw the current Camarilla levels using the horizontal lines.
ClrPivot - Color of the Pivot horizontal line.
ClrS - Color of S1, S2, S3 horizontal lines.
ClrR - Color of R1, R2, R3 horizontal lines.
ClrM - Color of M0, M1, M2, M3, M4, M5 horizontal lines.
ClrCamarilla - Color of the Camarilla horizontal lines.
ClrTxt - Color of texts with horizontal lines names.
AttachSundToMond - Attach Sunday bars to Monday.