Random walk index
This professional-grade solution for MetaTrader 5 helps traders achieve greater efficiency in their daily workflow. This technical indicator acts as a specialized analysis tool designed to visualize market data. It helps traders identify emerging trends, momentum shifts, and key support or resistance levels by plotting statistical calculations directly onto price charts.
How to Setup and Use Random walk index
1. Installation: Place your file in the MQL/Indicators folder via "Open Data Folder" and restart your terminal.
2. Loading: Find the indicator in the Navigator, drag it onto your chart, and configure the input parameters in the popup window.
3. Customization: Press Ctrl+I to open the indicator list, select your tool, and click "Properties" to change colors, levels, or visual styles.
4. Updating: Replace the old file in the Indicators folder with the new version and restart the platform to apply changes.
Frequently Asked Questions
Q: Why is my indicator not showing? A: Verify the file is in the MQL/Indicators folder, or try right-clicking the "Indicators" tree in the Navigator and clicking "Refresh."
Q: Do custom indicators slow down the platform? A: Too many complex indicators can impact performance; remove unused ones via the "Indicator List" (Ctrl+I).
Q: Can I use MT4 indicators on MT5? A: No, MQL4 and MQL5 are distinct languages; ensure the indicator is compiled specifically for your platform version.
Description & Settings
General description : The random walk index was created by Michael Poulos in order to determine if a security's current price action is exhibiting "random walk" or is the result of a statistically significant trend, higher or lower.
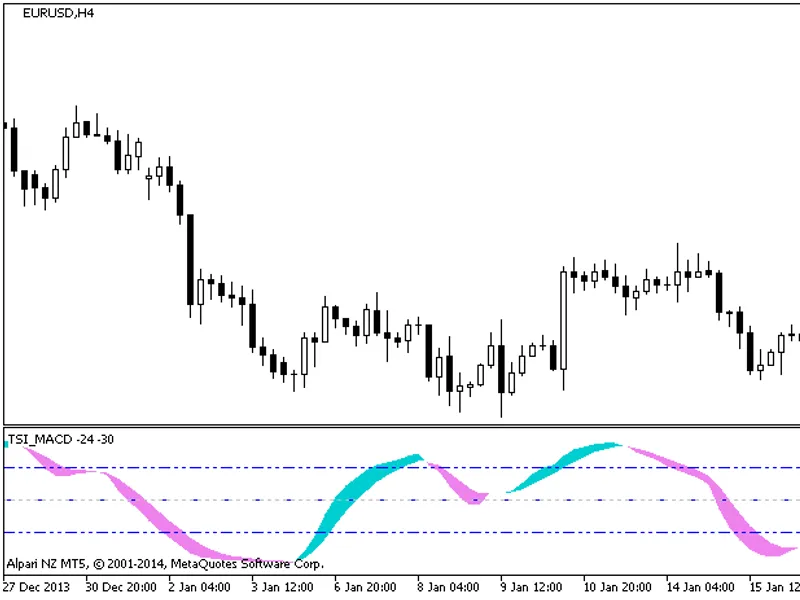
The random walk index has two lines, a RWI High and RWI Low, which measure uptrend and downtrend strength.
When the RWI High is above the RWI Low, it means there is more upward strength than downward strength, and vice versa.
When either the RWI High or RWI Low is above one, it indicates a strong, non-random, trend is present. Readings below one mean movement could be random because there is not enough strength to indicate otherwise.
Calculation : The calculation for high periods, or RWI High, is: The calculation for low periods, or RWI Low, is:
Changes :
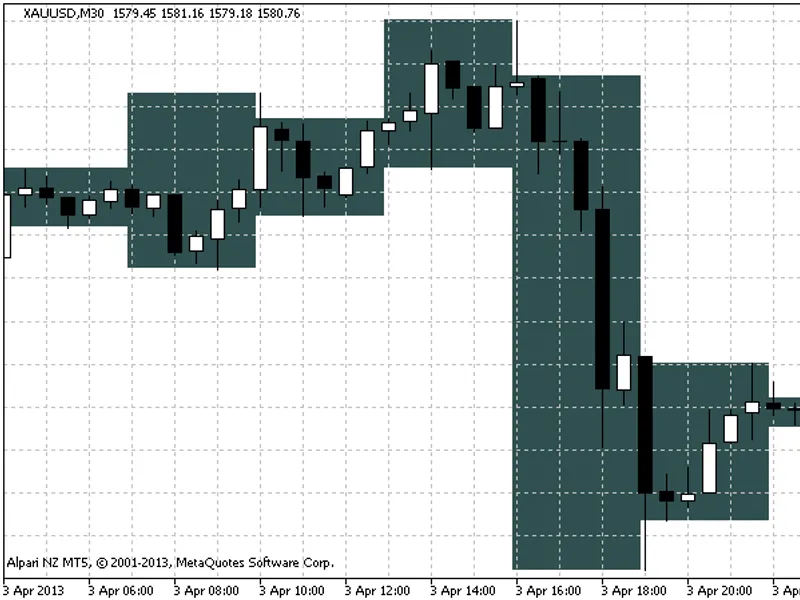
int its original form it is hard to use (RWI is a "nervous" indicator - a lot of sudden changes and then it is not easy to check what the "trend" is)
it has a very complex calculation (loop within a loop type of calculation that can not be avoided a lot of times) - and for longer periods it is heavy on the CPU
the interface is changed to make it (at least that is my opinion) easier to follow
and, in a lot of cases it is significantly faster (now it becomes suitable for back-testing - average speed up in back-testing ranged, for default values, from 10 to 15 times faster, for longer periods - like the examples, the difference is much higher)
One deviation is made compared to the original which makes the values a bit different, but the significant points (crosses) are remaining at their original places