Normalized RS I
This is a powerful addition to your MetaTrader 5 toolkit designed to optimize market analysis and performance. This technical indicator acts as a specialized analysis tool designed to visualize market data. It helps traders identify emerging trends, momentum shifts, and key support or resistance levels by plotting statistical calculations directly onto price charts.
How to Setup and Use Normalized RS I
1. Installation: Place your file in the MQL/Indicators folder via "Open Data Folder" and restart your terminal.
2. Loading: Find the indicator in the Navigator, drag it onto your chart, and configure the input parameters in the popup window.
3. Customization: Press Ctrl+I to open the indicator list, select your tool, and click "Properties" to change colors, levels, or visual styles.
4. Updating: Replace the old file in the Indicators folder with the new version and restart the platform to apply changes.
Frequently Asked Questions
Q: Why is my indicator not showing? A: Verify the file is in the MQL/Indicators folder, or try right-clicking the "Indicators" tree in the Navigator and clicking "Refresh."
Q: Do custom indicators slow down the platform? A: Too many complex indicators can impact performance; remove unused ones via the "Indicator List" (Ctrl+I).
Q: Can I use MT4 indicators on MT5? A: No, MQL4 and MQL5 are distinct languages; ensure the indicator is compiled specifically for your platform version.
Description & Settings
Some indicators are working equal for all calculation lengths some are not. One example that is not is RSI. Even though it is taken for granted that it oscillates in 0-100 range (so it is normalized already) and regardless of it's obvious usefulness, every serious study stresses not to use lengths > 10 for RSI.
The "RSI problem" is simple: the longer the calculating period, the flatter the RSI becomes. Here is an example of a 50 period RSI:
As it is obvious, it is hardly usable for anything in the original for such a long calculating periods. There were quite a few attempts to change that: Smoothed RSI (that partially avoids that trap, but it quickly loses the advantage over standard RSI), Inverse Fisher Transform of RSI (which also is flattened after some time - here is a comparison of RSI 50 and Inverse Fisher Transform of 50 RSI), and some more.
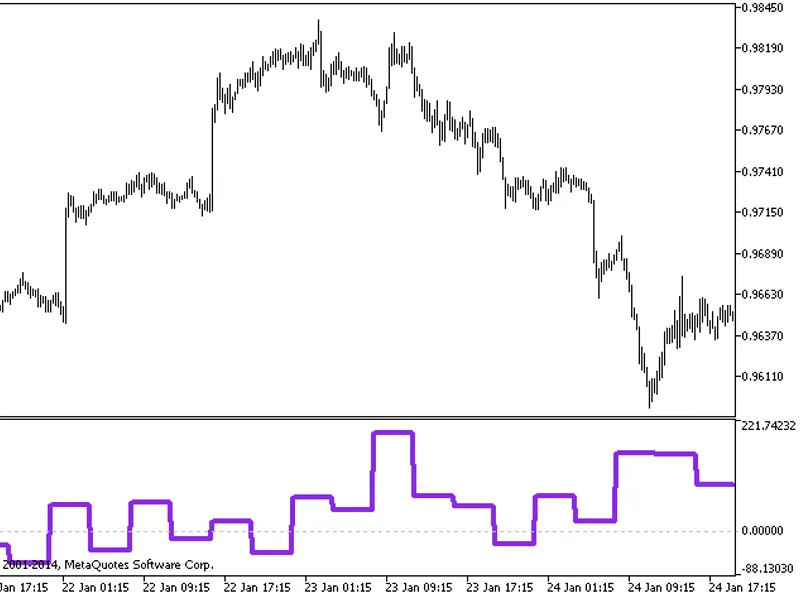
This is one more way that it can possible be done. Here is the example of the same RSI from above but "normalized" to -50 to +50 range:
Some of the issues that were observed are fixed and, the most important, "flattening" is not there any more.
PS: some experimenting is advised (as usual when it comes to "experiments" like these).