SM I Ergodic Oscillator
This professional-grade solution for MetaTrader 5 helps traders achieve greater efficiency in their daily workflow. This technical indicator acts as a specialized analysis tool designed to visualize market data. It helps traders identify emerging trends, momentum shifts, and key support or resistance levels by plotting statistical calculations directly onto price charts.
How to Setup and Use SM I Ergodic Oscillator
1. Installation: Place your file in the MQL/Indicators folder via "Open Data Folder" and restart your terminal.
2. Loading: Find the indicator in the Navigator, drag it onto your chart, and configure the input parameters in the popup window.
3. Customization: Press Ctrl+I to open the indicator list, select your tool, and click "Properties" to change colors, levels, or visual styles.
4. Updating: Replace the old file in the Indicators folder with the new version and restart the platform to apply changes.
Frequently Asked Questions
Q: Why is my indicator not showing? A: Verify the file is in the MQL/Indicators folder, or try right-clicking the "Indicators" tree in the Navigator and clicking "Refresh."
Q: Do custom indicators slow down the platform? A: Too many complex indicators can impact performance; remove unused ones via the "Indicator List" (Ctrl+I).
Q: Can I use MT4 indicators on MT5? A: No, MQL4 and MQL5 are distinct languages; ensure the indicator is compiled specifically for your platform version.
Description & Settings
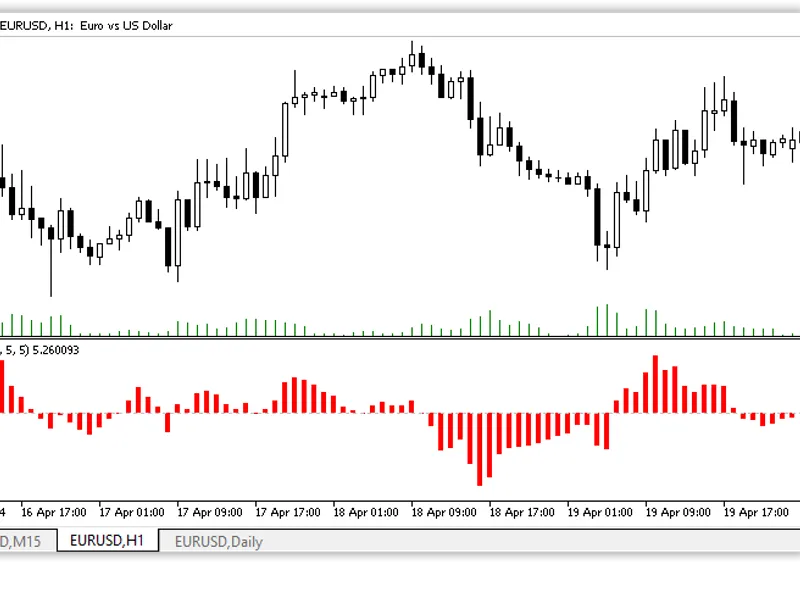
The SMI Ergodic Oscillator indicator displays the difference between the and its exponentially smoothed signal line.
It has three adjustable parameters:
Long Length
- primary smoothing period for TSI calculation
Short Length
- secondary smoothing period for TSI calculation.
Signal Line Length
- period of signal line smoothing for SMI calculation.
The ergodic oscillator gives the following signals related to the zero level crossing:
Finding the oscillator line for a long time in the zone below zero and then crossing it from bottom to top indicates the possibility of opening a long position;
Similarly, when the oscillator is above zero level for a long time and then crosses it from top to bottom, it indicates a favourable moment to open a short position.