Wmi For 3. 5 for MT5 (with DT W engine)
This tool for MetaTrader 5 is specifically engineered to streamline your trading operations. This technical indicator acts as a specialized analysis tool designed to visualize market data. It helps traders identify emerging trends, momentum shifts, and key support or resistance levels by plotting statistical calculations directly onto price charts.
How to Setup and Use Wmi For 3. 5 for MT5 (with DT W engine)
1. Installation: Place your file in the MQL/Indicators folder via "Open Data Folder" and restart your terminal.
2. Loading: Find the indicator in the Navigator, drag it onto your chart, and configure the input parameters in the popup window.
3. Customization: Press Ctrl+I to open the indicator list, select your tool, and click "Properties" to change colors, levels, or visual styles.
4. Updating: Replace the old file in the Indicators folder with the new version and restart the platform to apply changes.
Frequently Asked Questions
Q: Why is my indicator not showing? A: Verify the file is in the MQL/Indicators folder, or try right-clicking the "Indicators" tree in the Navigator and clicking "Refresh."
Q: Do custom indicators slow down the platform? A: Too many complex indicators can impact performance; remove unused ones via the "Indicator List" (Ctrl+I).
Q: Can I use MT4 indicators on MT5? A: No, MQL4 and MQL5 are distinct languages; ensure the indicator is compiled specifically for your platform version.
Description & Settings
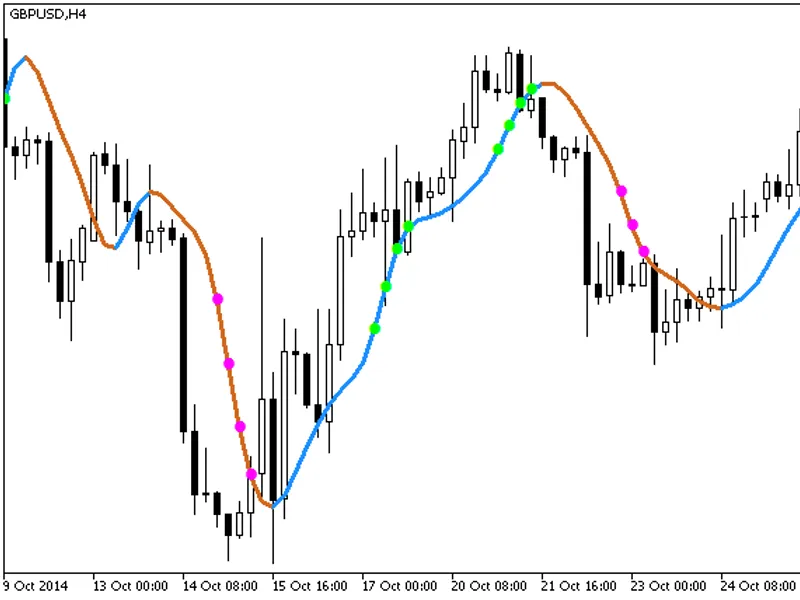
This indicator predicts possible future price movements by searching for similar candle patterns in the rate history.
This is an adaptation of original indicator WmiFor 3.0 (with dynamic time warping engine, DTW) for .
Input parameters
IsTopCorner - Info panel in upper corner
OffsetInBars - Offset backward in bars (to check forecast) [1..]
IsOffsetStartFixed - Keep offset of the start of the pattern (move synchronously with new bar formation)
IsOffsetEndFixed - Keep offset of the end of the pattern (move synchronously with new bar formation)
PastInBars - Length of the pattern to search (in bars) [3..]
VarShiftInBars - Variation of the found candidates' length (in bars) [0..]
ForecastInBars - Forecast this number of bars [1..]
MaxAgeInDays - Maximal history age to search (in days) [1..]
MaxVarInPercents - Maximal allowed tolerance in candidates (%) [0..100]
MaxAlts - Maximal number of candidates to find [1..]
ShowPastAverage - Show average price movement of candidates from history
ShowForecastAverage - Show average line with price forecast
ShowBestPattern - Show the best candidate (disables the average line)
ShowTip - Show trading tip
IndicatorPastAverageColor - Color of the average line on history
IndicatorCloudColor - Color of the range of candidates (high and low)
IndicatorBestPatternColor - Color of the best candidate
IndicatorVLinesColor - Color of vertical boundaries of the pattern
IndicatorTextColor - Color of the info panel and tip
IndicatorTakeProfitColor - TakeProfit and StopLoss color
XCorner - Margin from left/right borders of the chart
YCorner - Margin from upper/lower borders of the chart