

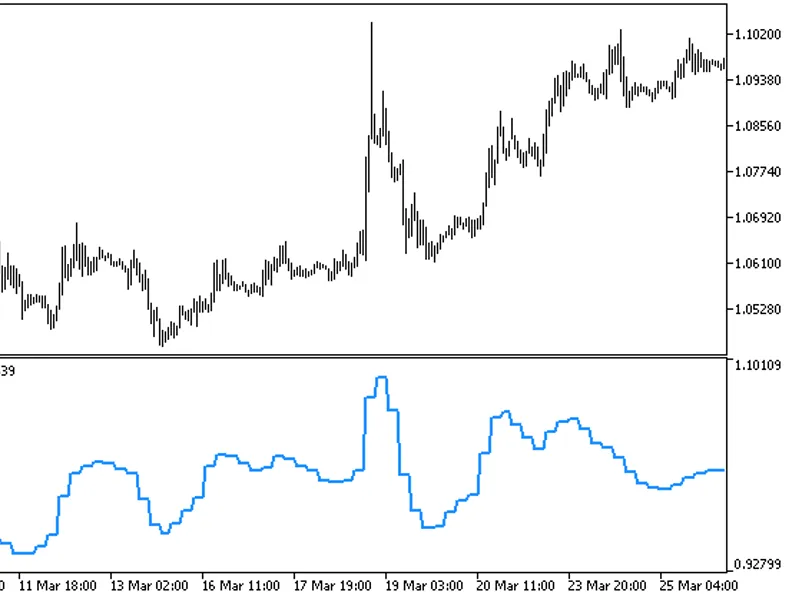
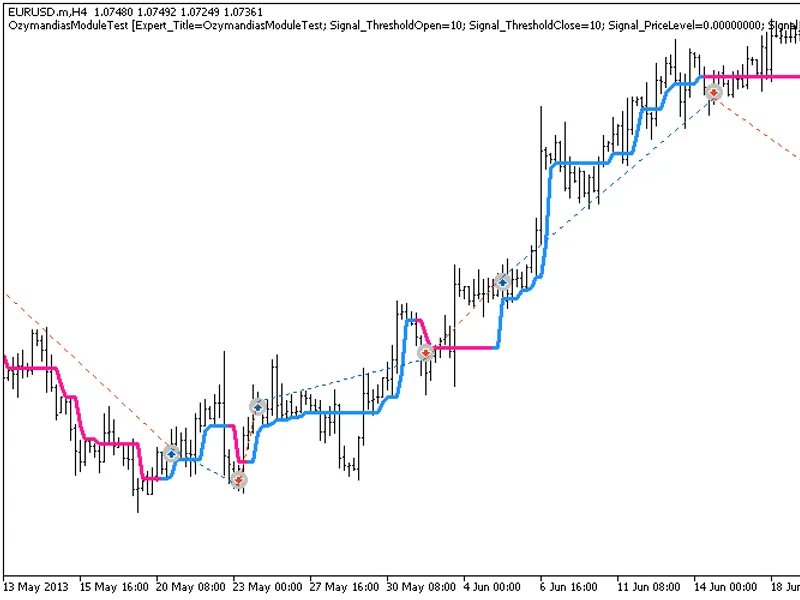
Mouteki DeMark Enhanced with FDI and Hurst Exponent for MetaTrader 5
Info
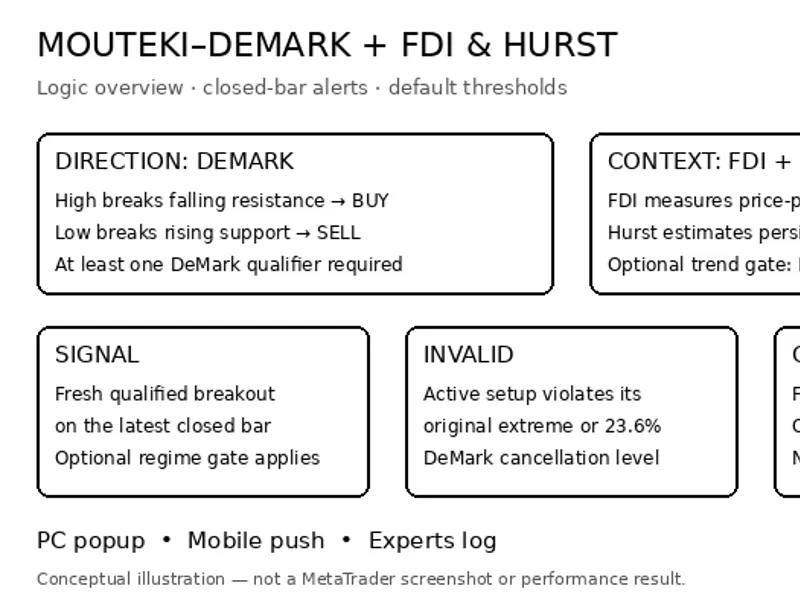
The Mouteki DeMark Enhanced with FDI and Hurst Exponent for MetaTrader 5 is a Indicator for MetaTrader 5 that mouteki-demark trendline analysis featuring the fractal dimension index (fdi), an independently calculated hurst exponent, and an integrated market dashboard. This indicator identifies potential breakout setups, displays projected price targets, and provides desktop, mobile, and terminal log notifications.
Usage
This tool is typically used for enhancing chart analysis and decision making.
Platform
This Indicator works exclusively on MetaTrader 5 (both build 600+ and newer versions).
Setup
Place the downloaded file in MQL5/Indicators folder via File ? Open Data Folder in MetaTrader 5.
How to Install and Use Mouteki DeMark Enhanced with FDI and Hurst Exponent for MetaTrader 5
1. Installation: Place your file in the MQL/Indicators folder via "Open Data Folder" and restart your terminal.
2. Loading: Find the indicator in the Navigator, drag it onto your chart, and configure the input parameters in the popup window.
3. Customization: Press Ctrl+I to open the indicator list, select your tool, and click "Properties" to change colors, levels, or visual styles.
4. Updating: Replace the old file in the Indicators folder with the new version and restart the platform to apply changes.
Frequently Asked Questions
Q: Why is my indicator not showing? A: Verify the file is in the MQL/Indicators folder, or try right-clicking the "Indicators" tree in the Navigator and clicking "Refresh."
Q: Do custom indicators slow down the platform? A: Too many complex indicators can impact performance; remove unused ones via the "Indicator List" (Ctrl+I).
Q: Can I use MT4 indicators on MT5? A: No, MQL4 and MQL5 are distinct languages; ensure the indicator is compiled specifically for your platform version.
What this tool does
Mouteki-DeMark trendline analysis featuring the Fractal Dimension Index (FDI), an independently calculated Hurst exponent, and an integrated market dashboard.
Typical Use Case
This Indicator excels in automated trading and technical analysis on MetaTrader 5.
Compatible Platform & Setup
This Indicator works on MetaTrader 5. Place the file in the MQL5/Indicators folder and restart the terminal.
Description & Settings
Related: CronEx T DeMarker GF - another powerful indicator for MetaTrader 5 traders.
Mouteki-DeMark trendline analysis featuring the Fractal Dimension Index (FDI), an independently calculated Hurst exponent, and an integrated market dashboard.Also recommended: DeMarker HTF Indicator - similar indicator with strong performance on MetaTrader 5.
This indicator identifies potential breakout setups, displays projected price targets, and provides desktop, mobile, and terminal log notifications. All calculations are embedded within the indicator; no external custom indicator is required.
The implementation is adapted from Mouteki-Demark_trend_new.mq4. Original credits are retained for GreenDog / GameOver and Kara. The MT5 adaptation includes closed-bar regime measurements, a consolidated dashboard, and an event-based alert system. This is an analytical indicator, not an Expert Advisor.
DeMark Trendlines and Breakout Interpretation
A descending resistance line is constructed using a recent confirmed pivot high and an older, higher pivot high. A rising support line is constructed using a recent confirmed pivot low and an older, lower pivot low. Pivot confirmation requires completed candles on both sides of the pivot. Increasing the pivot level generally reduces the number of eligible turning points and delays their confirmation.
A potential BUY breakout occurs when a bar's high exceeds descending resistance. A potential SELL breakout occurs when a bar's low falls below rising support. At least one of the three inherited DeMark qualifiers must also be satisfied. Closed-bar analysis means that the bar must have finished; it does not require the closing price itself to finish beyond the trendline.
Qualifier
BUY breakout
SELL breakout
1
Previous close is less than the close before it.
Previous close is greater than the close before it.
2
Breakout-bar open is greater than the line value at that bar.
Breakout-bar open is less than the line value at that bar.
3
2 * previous close - previous low is less than the line value.
2 * previous close - previous high is greater than the line value.
The dashboard distinguishes between insufficient pivots, no breakout, false break, qualified break, and cancelled setups. A false break is a line crossing without a qualifying condition. A qualified setup is cancelled if subsequent bars breach the intervening extreme or the inherited 23.6% cancellation threshold. A cancelled setup differs from a false break: it qualified first and failed later.
T1–T3 retain the inherited projections based on the distance between the trendline and intervening extremes or closing prices. T4 retains the original 1.618 extension formula. Their labels identify formulas, not an ascending sequence: targets are not sorted, may change with new pivot pairs, and can produce negative directional distances. They are analytical reference levels rather than guaranteed profit objectives.
Fractal Dimension Index
FDI measures the geometric roughness of the closing-price path. Time is normalized by the number of intervals, and price changes are normalized by the highest-to-lowest close range in the window. If L is the resulting polyline length and N is the number of closes, the implementation uses D = 1 + ln(2L) / ln(2(N - 1)). This is a normalized path estimator, not a box-counting calculation.
With the default thresholds, FDI below 1.45 is labeled trend-like, while FDI above 1.55 is labeled rough or range-like. Intermediate readings are transitional. A flat window has no valid normalized price range and displays N/A. FDI measures path structure; it does not determine whether the direction is BUY or SELL.
Hurst Exponent
Hurst is calculated independently using multi-scale rescaled-range (R/S) analysis of logarithmic returns. For block sizes 8, 16, 32, and so on up to half the return window, the indicator averages valid R/S values over non-overlapping blocks. The Hurst estimate is the ordinary least-squares slope of ln(mean R/S) against ln(block size). It is not derived by subtracting FDI from 2.
The default interpretation is Hurst above 0.55 for persistence, below 0.45 for anti-persistence or mean-reverting behavior, and 0.45–0.55 for random-like or uncertain behavior. These are configurable interpretation thresholds. Finite-window R/S estimates can be biased and may fall outside the theoretical 0–1 interval; raw estimates are not clamped. Insufficient or degenerate data produces N/A.
Both metrics use the latest completed candle on the chart timeframe and refresh when a new bar begins. At the default settings, FDI uses 64 closing prices and Hurst uses 256 returns, requiring 257 completed closing prices. They describe statistical context rather than prove that a trend will continue or that a reversal will occur.
Optional Regime Filter
The regime filter is disabled by default, so raw DeMark setups remain available regardless of FDI/Hurst conditions. When enabled, a fresh SIGNAL and its tracked setup must satisfy FDI < InpFDITrend AND Hurst > InpHurstTrend; the defaults are FDI < 1.45 and Hurst > 0.55. The dashboard then displays PASS REGIME or REGIME BLOCK for qualified chart setups.
This filter gates new signal notifications and tracking; it does not remove raw historical DeMark arrows, trendlines, or targets. Therefore, a chart can contain a qualified DeMark marker without a corresponding SIGNAL notification. A continuing qualified dashboard status is not a new signal on every candle.
Notifications and Early-Close Advisories
Event
Meaning
SIGNAL BUY / SIGNAL SELL
A newly qualified breakout on the latest completed bar, subject to the optional regime filter.
INVALID BUY / INVALID SELL
A tracked setup violates its stored original extreme or 23.6% cancellation level. It does not refer to every historical false break.
CLOSE EARLY BUY / CLOSE EARLY SELL
A tracked setup encounters FDI ≥ InpExitFDIMin AND Hurst ≤ InpExitHurstMax; defaults 1.55 and 0.55.
Early-close detection includes random-like and mean-reverting readings, provided FDI is also sufficiently rough. Both conditions must hold on the same completed-bar calculation. The advisory is issued once per tracked setup. If the regime filter is off and a fresh DeMark breakout already meets the sideways conditions, SIGNAL and CLOSE EARLY can both appear for that bar. For an existing setup, invalidation takes precedence over an early-close warning.
Notifications are checked once per new completed bar, including when the chart display uses live/provisional breakout analysis. Old signals are not replayed when the indicator is attached. Restarting, reinitializing, changing settings, or rebuilding history clears tracked setups; subsequent follow-up advisories require a newly detected setup. Stored cancellation levels remain associated with their original tracked setup when chart pivot pairs change.
Messages contain the event, direction, symbol, timeframe, and bar timestamp, with relevant levels or FDI/Hurst readings. Desktop popups, mobile push, and Print logging have independent switches. By default, only step 1 is monitored for alerts; monitoring all configured steps adds the step number to each message.
Mobile push requires Enable Push Notifications and a valid MetaQuotes ID in the terminal’s Options → Notifications settings. This version queues push messages and reserves one send every seven seconds across its instances; other programs still share terminal notification limits. Failed sends are retried up to three times, and queued messages are not retained after removal or restart. Popup and push delivery must be checked in a running terminal rather than the Strategy Tester.
CLOSE EARLY is an advisory, not an automatic position-closing command. The indicator does not inspect open positions, profit, manual exits, or take-profit execution. A tracked analytical setup can therefore generate a follow-up warning after a user has already closed the corresponding trade. No trading orders are submitted or modified.
Dashboard and Daily Market Data
The panel consolidates live price, Bid, Ask, spread in symbol points, current daily high and low, and the daily range in price units and points. The main live-price field uses Last when available and otherwise Bid. Daily statistics use the broker’s current D1 candle, so the day boundary follows broker server time rather than the user’s local midnight. The daily range is High minus Low, not an average daily range or ATR.
Additional fields show FDI/Hurst readings and interpretations, the combined regime, display switches, projection mode, and per-step BUY/SELL cards. Each card contains pivot prices, the projected level, qualifier information, breakout source, T1–T4 with directional point distances, and the breakout bar time. Points use the symbol’s _Point value without assuming a fixed pip conversion.
External Inputs
The following tables list every external input in version 1.10. Periods and thresholds refer to the current chart timeframe. Display switches do not disable calculations unless explicitly stated. Color defaults use RGB notation; true and false are Boolean switches.
Mouteki / DeMark
Input
Default
Purpose
InpShowBars
200
Number of bars scanned for DeMark pivots. 0 scans all loaded history; larger scans increase work.
InpPivotLevel
2
Bars required on each side of a pivot (1–100). Only completed bars confirm pivots; this adds confirmation delay.
InpSteps
1
Number of trendline pairs (1–3). A step is a different pivot selection, not a timeframe.
InpBackStep
0
Non-negative offset into the pivot sequence. Selects older pivots.
InpStartBar
0
0 projects the breakout level to the current bar; 1 projects it one bar forward. The shift applies only when step + BackStep = 1. It does not predict price.
InpTrend
0
0 enables both directions; 1 enables rising support lines / SELL-break analysis only; −1 enables falling resistance lines / BUY-break analysis only.
InpTrendLines
true
Show the sloping DeMark trendlines.
InpBreakLevels
true
Show the horizontal projected breakout level for step + BackStep = 1.
InpChannels
false
Draw a parallel channel through the intervening low or high.
InpTargetLines
true
Draw T1–T4 as horizontal dotted lines. Dashboard targets remain available when lines are hidden.
InpPivotDots
true
Display confirmed pivot dots. Hiding them does not disable pivot calculations.
InpBreakArrows
true
Display historical breakout or cancellation markers; does not control notifications.
InpClosedBreakouts
true
true: chart breakout/cancellation analysis uses completed bars. false: chart status also considers the live bar and can change intrabar. Notifications always use a separate completed-bar snapshot.
FDI / Hurst
Input
Default
Purpose
InpFDIPeriod
64
FDI window in closing prices (8–4096).
InpHurstPeriod
256
Hurst window in logarithmic returns (64–4096); requires one additional closing price.
InpMetricHistory
300
Number of recent completed bars calculated for the FDI/Hurst buffers (1–5000). Does not set either calculation window.
InpFDITrend
1.45
FDI strictly below this value is classified as trend-like and can pass the optional regime gate.
InpFDIRange
1.55
FDI strictly above this value is classified as rough/range-like in its individual dashboard label. Must be above InpFDITrend and below 2.
InpHurstTrend
0.55
Hurst strictly above this value is persistent and can pass the optional regime gate.
InpHurstRevert
0.45
Hurst strictly below this value is labeled mean-reverting. Must be above 0 and below InpHurstTrend.
InpUseRegimeFilter
false
When true, a new SIGNAL and its tracked setup require FDI < InpFDITrend AND Hurst > InpHurstTrend. Also controls the dashboard verdict. Does not remove raw DeMark arrows or targets.
Signal / Invalid / Early Close Alerts
Input
Default
Purpose
InpPushAlert
true
Enable mobile push for selected event types. Requires terminal Notifications settings and a MetaQuotes ID.
InpPCAlert
true
Enable desktop Alert() popups for selected event types.
InpPrintAlert
true
Write event messages and notification diagnostics to the terminal log. Initialization errors can still be printed independently.
InpSignalAlert
true
Enable SIGNAL BUY/SELL event messages. Turning this off does not stop internal setup tracking or independently enabled follow-up event types.
InpInvalidAlert
true
Enable INVALID messages for tracked setups that violate their original cancellation conditions.
InpEarlyCloseAlert
true
Enable a CLOSE EARLY advisory when both sideways thresholds are met. One warning per tracked setup; no order execution.
InpAlertAllSteps
false
false monitors step 1 only; true monitors all configured steps and includes the step number in messages.
InpExitFDIMin
1.55
Minimum FDI for an early-close advisory (inclusive). Must be between 1 and 2.
InpExitHurstMax
0.55
Maximum Hurst for an early-close advisory (inclusive). Must be between 0 and 1; includes random-like and anti-persistent readings at the default.
Premium Dashboard
Input
Default
Purpose
InpDashboard
true
Show or hide the panel. Calculations, chart objects, and enabled alerts remain active.
InpInstanceID
You may also like: DeMarker 3-Timeframe Indicator - excellent alternative for indicator users on MetaTrader 5.
Source Code
#property copyright "RobotFX"
#property version "1.10"
#property strict
#property indicator_chart_window
#property indicator_buffers 6
#property indicator_plots 6
#property indicator_label1 "DeMark high"
#property indicator_type1 DRAW_ARROW
#property indicator_color1 clrTomato
#property indicator_label2 "DeMark low"
.......
⚠ Limitations & Risk Warning
- This tool is provided for educational and testing purposes only.
- Past performance does not guarantee future results.
- Trading involves substantial risk of loss. Use on a demo account first.
- Results may vary depending on market conditions, broker, and settings.
- We recommend thorough backtesting and forward testing before using with real funds.