Money-Meter
This tool for MetaTrader 5 is specifically engineered to streamline your trading operations. This technical indicator acts as a specialized analysis tool designed to visualize market data. It helps traders identify emerging trends, momentum shifts, and key support or resistance levels by plotting statistical calculations directly onto price charts.
How to Setup and Use Money-Meter
1. Installation: Place your file in the MQL/Indicators folder via "Open Data Folder" and restart your terminal.
2. Loading: Find the indicator in the Navigator, drag it onto your chart, and configure the input parameters in the popup window.
3. Customization: Press Ctrl+I to open the indicator list, select your tool, and click "Properties" to change colors, levels, or visual styles.
4. Updating: Replace the old file in the Indicators folder with the new version and restart the platform to apply changes.
Frequently Asked Questions
Q: Why is my indicator not showing? A: Verify the file is in the MQL/Indicators folder, or try right-clicking the "Indicators" tree in the Navigator and clicking "Refresh."
Q: Do custom indicators slow down the platform? A: Too many complex indicators can impact performance; remove unused ones via the "Indicator List" (Ctrl+I).
Q: Can I use MT4 indicators on MT5? A: No, MQL4 and MQL5 are distinct languages; ensure the indicator is compiled specifically for your platform version.
Description & Settings
The indicator measures money on a chart.
Why do we need it?
Conventional MetaTrader charts are usually measured in points making it difficult to quickly convert them into money when you need to evaluate a position lot (or several lots).
Of course, you can calculate in your mind or use a calculator.
However, this is not always convenient. Besides, traders usually set lots by rule of thumb, rather than applying certain numbers. Sometimes, they even do not calculate risks for the applied volume.
What does this indicator do?
The indicator displays cost levels above and below a selected zero level.
What are cost levels?
This is the amount of funds that will be lost or added to the account if you open a position with a specified lot from the zero level.
What is a zero level?
By default, the indicator starts calculation from the current price, but if you enter the price in the zero_price parameter, it will calculate from that price.
What other parameters does the indicator have?
grid_step_value – grid step in the deposit currency
lot_size – working lot for virtual position
lot_divider – lot divider (divides volume by the specified value)
total_levels – how many levels to draw up and down
zero_price – price to be used as a zero level
progression – progression type (see below)
multiplicator – multiplier for progression
lines_color – grid lines color
lines_width – grid lines width
lines_style – grid lines style
lines_prices – displaying grid level price on the price scale
text_shift_bars – shift captions left/right according to the number of bars
How to apply this all?
Select the lot_size working lot for the future position and set the grid step in money grid_step_value. The indicator shows levels when position gains the appropriate profit or loss (excluding swaps and commissions). This means, each grid level forms addition or subtraction of a specified grid_step_value to a position. Each level is signed, thus, it clearly shows how much you can lose or earn if the price reaches the appropriate level.
What is lot_divider parameter needed for?
For some brokers with non-standard contracts. For example, there is one well-known broker setting a point price 100 000 times higher than what it should be. Therefore, you need to specify this number as a divisor of the lot_divider volume in order to correct the calculations.
Why do you need a 'progression' parameter?
By default, the indicator counts the profit/loss for one position of a specified volume, and the progression allows estimating the amount of profits/losses. Consecutive additions at each grid level help to quickly assess the overall depth of the drawdown for a series of averaging positions or the total profit for pyramiding.
What progressions do we have here?
nonе – no progressions
equal – equal volume positions
linear – volumes grow linearly as a natural series
fibo – volumes grow by Fibo numbers
martin – geometric progression with the 'multiplicator' multiplier
What are the indicator signals?
The indicator provides no signals. It is needed for rapid risk assessment before opening a position.
How to assess risks for already open positions?
You may use another indicator for that: Smart-Calculator.
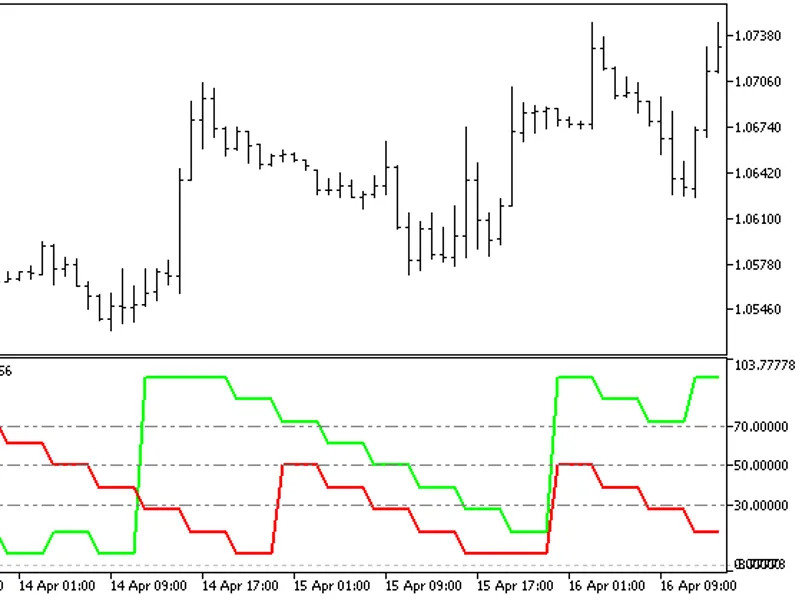
How does it look like?