Mass Index
This is a powerful addition to your MetaTrader 5 toolkit designed to optimize market analysis and performance. This technical indicator acts as a specialized analysis tool designed to visualize market data. It helps traders identify emerging trends, momentum shifts, and key support or resistance levels by plotting statistical calculations directly onto price charts.
How to Setup and Use Mass Index
1. Installation: Place your file in the MQL/Indicators folder via "Open Data Folder" and restart your terminal.
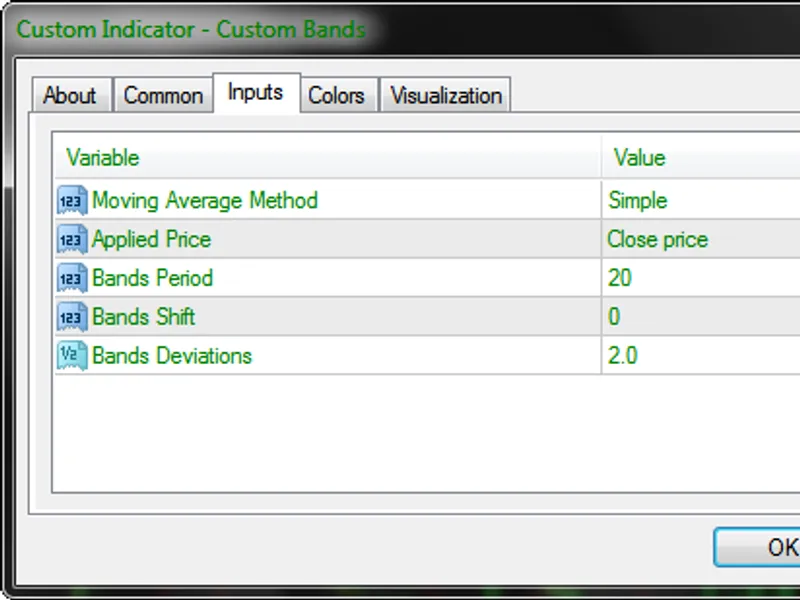
2. Loading: Find the indicator in the Navigator, drag it onto your chart, and configure the input parameters in the popup window.
3. Customization: Press Ctrl+I to open the indicator list, select your tool, and click "Properties" to change colors, levels, or visual styles.
4. Updating: Replace the old file in the Indicators folder with the new version and restart the platform to apply changes.
Frequently Asked Questions
Q: Why is my indicator not showing? A: Verify the file is in the MQL/Indicators folder, or try right-clicking the "Indicators" tree in the Navigator and clicking "Refresh."
Q: Do custom indicators slow down the platform? A: Too many complex indicators can impact performance; remove unused ones via the "Indicator List" (Ctrl+I).
Q: Can I use MT4 indicators on MT5? A: No, MQL4 and MQL5 are distinct languages; ensure the indicator is compiled specifically for your platform version.
Description & Settings
MetaQuotes
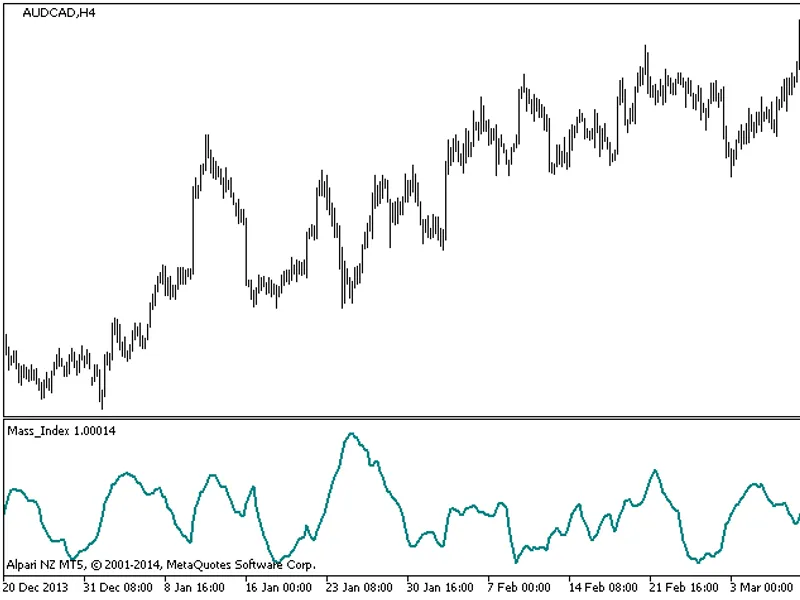
The Mass Index is intended for detection of trend turns based on changes in the bandwidth between the highest and the lowest prices. If the bandwidth expands, the Mass Index increases, if it narrows, the index decreases.
The Mass Index was developed by Donald Dorsey. A special model constructed by the indicator and called 'reversal bulge' should be considered the most important signal from the Mass Index. The reversal bulge is formed when the 25-period mass index, first, exceeds 27 and then falls below 26.5. In this case, the price turn is quite possible independently on the general nature of the trend, and it does not matter, whether prices move up, down or fluctuate within the trading range.
To detect what exactly signal - to buy or to sell - is produced by the reversal bulge, 9-period exponential moving average of prices is frequently used. When a reversal bulge appears, it is time to buy, if the moving average falls (with a view to a reversal), and sell, if it increases.
The indicator uses SmoothAlgorithms.mqh library classes (must be copied to the terminal_data_folder\MQL5\Include). The use of the classes was thoroughly described in the article .
This indicator was first implemented in MQL4 and published in on 08.02.2007.
Fig.1. Mass_Index Indicator