Prev Day Lines. mq4 - Draw Previous Day's High, Low, and Average Price Lines
This is a powerful addition to your MetaTrader 4 toolkit designed to optimize market analysis and performance. This script functions as a utility program designed for specific, one-time execution tasks. It is utilized to perform targeted actions, such as closing all open orders, managing chart objects, or executing custom administrative commands on demand.
How to Setup and Use Prev Day Lines. mq4 - Draw Previous Day's High, Low, and Average Price Lines
1. Installation: Move your script file into the MQL/Scripts directory and restart the platform.
2. Execution: Drag the script onto a chart; it will perform a one-time action, such as closing all open orders or clearing chart objects.
3. Editing: Use MetaEditor (F4) to modify code, click "Compile," and verify no errors appear in the terminal before running.
4. Removing: Scripts stop automatically, but you can remove them manually by right-clicking the chart and choosing "Remove Script."
Frequently Asked Questions
Q: How are scripts different from EAs? A: Scripts execute a single action and then stop; EAs monitor the market and trade continuously.
Q: Can I assign a hotkey to a script? A: Yes, right-click the script in the Navigator, select "Set Hotkey," and define your preferred keyboard shortcut.
Q: Why did my script stop? A: Scripts are designed to stop immediately after finishing their programmed command; this is normal behavior.
Description & Settings
The
PrevDayLines.mq4
script is a tool for MetaTrader 4 that automatically draws three critical price levels from the previous trading day on your chart. These levels include the highest price (Max), the lowest price (Min), and the average price (Avg), providing traders with a clear visual reference for key support and resistance points. The script is fully customizable, allowing you to adjust the color, thickness, and style of the lines to suit your preferences.
Functionality:
Automatic Drawing of Price Levels:
The script calculates and draws horizontal lines on the chart representing the previous day's high, low, and average prices.
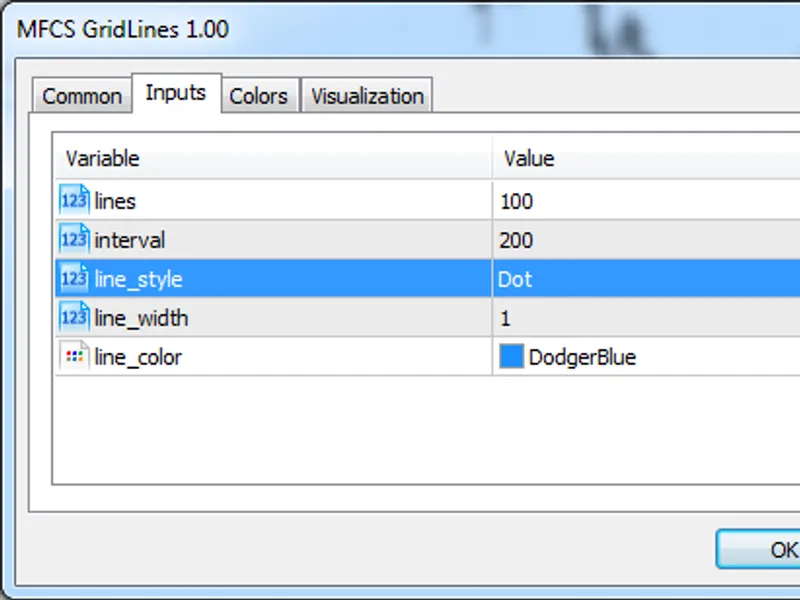
Customizable Visuals:
Users can easily customize the appearance of the lines by adjusting parameters such as color, width, and style (e.g., dotted, solid).
Easy Integration:
Simply run the script on any chart to instantly display the previous day's critical price levels, aiding in technical analysis and decision-making.
This script is particularly useful for traders who rely on historical price levels to identify potential market turning points.