US D X Slope
This tool for MetaTrader 5 is specifically engineered to streamline your trading operations. This technical indicator acts as a specialized analysis tool designed to visualize market data. It helps traders identify emerging trends, momentum shifts, and key support or resistance levels by plotting statistical calculations directly onto price charts.
How to Setup and Use US D X Slope
1. Installation: Place your file in the MQL/Indicators folder via "Open Data Folder" and restart your terminal.
2. Loading: Find the indicator in the Navigator, drag it onto your chart, and configure the input parameters in the popup window.
3. Customization: Press Ctrl+I to open the indicator list, select your tool, and click "Properties" to change colors, levels, or visual styles.
4. Updating: Replace the old file in the Indicators folder with the new version and restart the platform to apply changes.
Frequently Asked Questions
Q: Why is my indicator not showing? A: Verify the file is in the MQL/Indicators folder, or try right-clicking the "Indicators" tree in the Navigator and clicking "Refresh."
Q: Do custom indicators slow down the platform? A: Too many complex indicators can impact performance; remove unused ones via the "Indicator List" (Ctrl+I).
Q: Can I use MT4 indicators on MT5? A: No, MQL4 and MQL5 are distinct languages; ensure the indicator is compiled specifically for your platform version.
Description & Settings
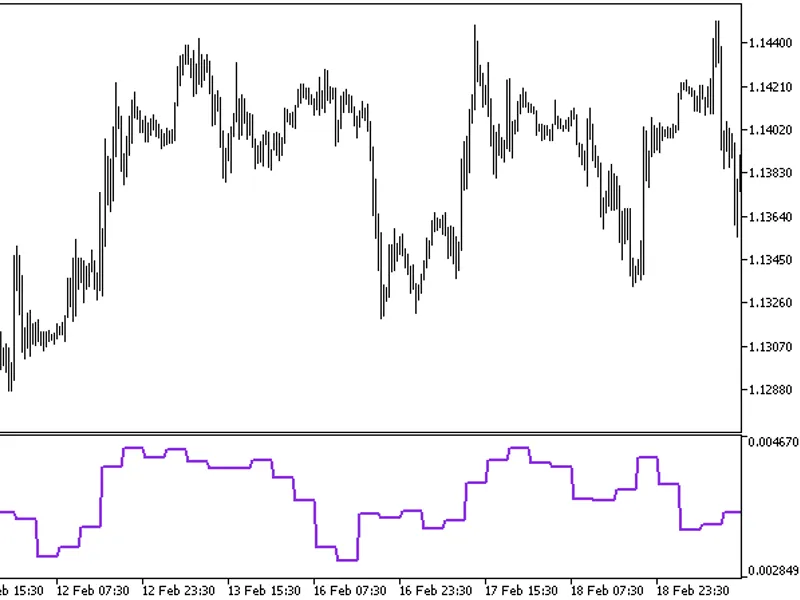
Indicator USDX vs Slope Direction Line is an information and signal indicator. It compares the line directions of two indicators, and , and shows in a separate window the colored signal pointers, the color of which corresponds with the match/mismatch of the directions of Slope Direction Line and USDX.
It has five adjustable parameters:
SDL Period
- Slope Direction Line calculation period
SDL Method
- Slope Direction Line calculation method
SDL Applied price
- Slope Direction Line calculation price
USDX slope shift
- shift between the two data points to identify the direction of the USDX line
USDX reverce
- chart reverse of USDX (Yes/No)
If the lines of USDX and Slope Direction Line are directed upwards:
the green signal pointer is set
If the lines of USDX and Slope Direction Line are directed downwards:
the red signal pointer is set
In any other case, the gray signal pointer is placed.
and are not required to be in the terminal, since they are calculated by the indicator independently.
Indicator USDX is calculated by Close prices
Fig. 1. USDX vs Slope Direction Line, USDX reverce = Yes, chart scale = 2
Fig. 2. USDX vs Slope Direction Line, USDX reverce = Yes, chart scale = 3
Fig. 3. USDX vs Slope Direction Line + USDX + Slope Direction Line, USDX reverce = Yes, chart scale = 2
Fig.4. USDX vs Slope Direction Line + USDX + Slope Direction Line, USDX reverce = Yes, chart scale = 3