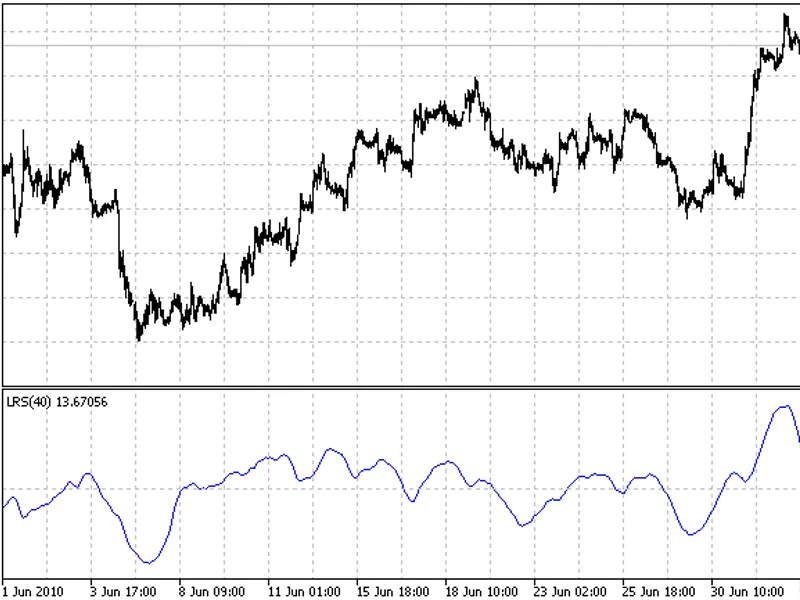
Linear regression slope
This software component for MetaTrader 5 is built to enhance the capabilities of your trading environment. This technical indicator acts as a specialized analysis tool designed to visualize market data. It helps traders identify emerging trends, momentum shifts, and key support or resistance levels by plotting statistical calculations directly onto price charts.
How to Setup and Use Linear regression slope
1. Installation: Place your file in the MQL/Indicators folder via "Open Data Folder" and restart your terminal.
2. Loading: Find the indicator in the Navigator, drag it onto your chart, and configure the input parameters in the popup window.
3. Customization: Press Ctrl+I to open the indicator list, select your tool, and click "Properties" to change colors, levels, or visual styles.
4. Updating: Replace the old file in the Indicators folder with the new version and restart the platform to apply changes.
Frequently Asked Questions
Q: Why is my indicator not showing? A: Verify the file is in the MQL/Indicators folder, or try right-clicking the "Indicators" tree in the Navigator and clicking "Refresh."
Q: Do custom indicators slow down the platform? A: Too many complex indicators can impact performance; remove unused ones via the "Indicator List" (Ctrl+I).
Q: Can I use MT4 indicators on MT5? A: No, MQL4 and MQL5 are distinct languages; ensure the indicator is compiled specifically for your platform version.
Description & Settings
Linear regression fits the following equation of a straight line to price data:
y[x] = y0 + b*x
where:
x is a bar number (x=1..n);
y[x] is the corresponding price (open, close, median etc);
b is a proportionality coefficient
y0 is a bias.
The linear regression slope, given by this indicator, is equal to a normalized version of the coefficient b.
The formula for b is:
b = (n*Sxy - Sx*Sy)/(n*Sxx - Sx*Sx)
where:
Sx = Sum(x, x = 1..n)= n*(n + 1)/2;
Sy = Sum(y[x], x = 1..n);
Sxx = Sum(x*x, x = 1..n) = n*(n+1)*(2*n+1)/6;
Sxy = Sum(x*y[x], x = 1..n);
n is the period of LRS (input parameter Per).
The denominator of b can be simplified to:
n*Sxx - Sx*Sx = n*n*(n-1)*(n+1)/12
Finally, the whole equation for b can be simplified to
b = 6*(2*Sxy/(n + 1) - Sy)/n/(n - 1)
The coefficient b is not normalized. It has to be normalized if we want LRS to have a roughly the same range for different currency pairs. It is convenient to normalize b by dividing it by either a simple moving average (SMA) or a linear weighted moving average (LWMA), which are given by:
SMA = Sy/nLWMA = 2*Sxy/n/(n + 1)
The corresponding versions of LRS are given by
LRS_SMA = b/SMA = 6*(2*Sxy/Sy/(n + 1) - 1)/(n + 1)
LRS_LWMA = b/LWMA = 6*(1 - (n + 1)*Sy/Sxy/2)/(n + 1)
These two versions of normalization are almost indistinguishable. So, the SMA normalization was chosen for the indicator. Also, because of very small values of the LRS, the indicator values are calculated and plotted in parts per 100 thousand to fit roughly into the range of -100 to +100.