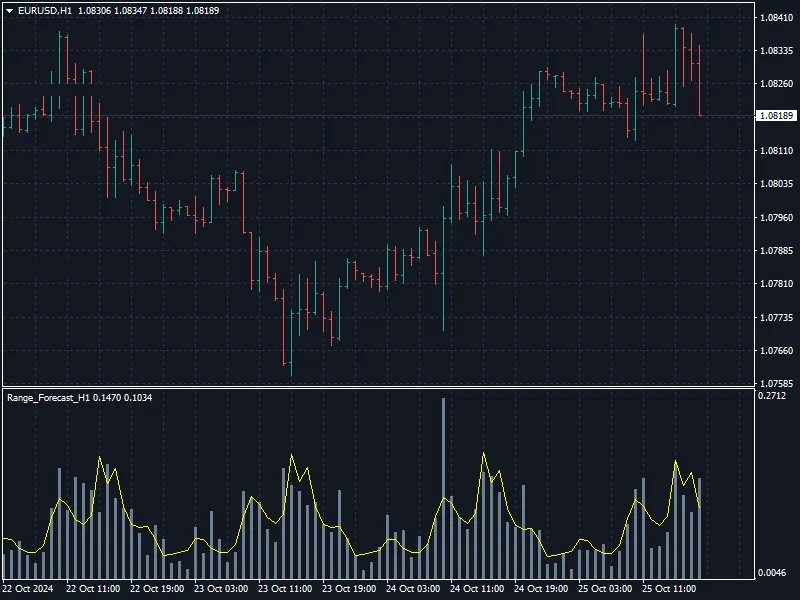
Range Forecast H1
This software component for MetaTrader 4 is built to enhance the capabilities of your trading environment. This technical indicator acts as a specialized analysis tool designed to visualize market data. It helps traders identify emerging trends, momentum shifts, and key support or resistance levels by plotting statistical calculations directly onto price charts.
How to Setup and Use Range Forecast H1
1. Installation: Place your file in the MQL/Indicators folder via "Open Data Folder" and restart your terminal.
2. Loading: Find the indicator in the Navigator, drag it onto your chart, and configure the input parameters in the popup window.
3. Customization: Press Ctrl+I to open the indicator list, select your tool, and click "Properties" to change colors, levels, or visual styles.
4. Updating: Replace the old file in the Indicators folder with the new version and restart the platform to apply changes.
Frequently Asked Questions
Q: Why is my indicator not showing? A: Verify the file is in the MQL/Indicators folder, or try right-clicking the "Indicators" tree in the Navigator and clicking "Refresh."
Q: Do custom indicators slow down the platform? A: Too many complex indicators can impact performance; remove unused ones via the "Indicator List" (Ctrl+I).
Q: Can I use MT4 indicators on MT5? A: No, MQL4 and MQL5 are distinct languages; ensure the indicator is compiled specifically for your platform version.
Description & Settings
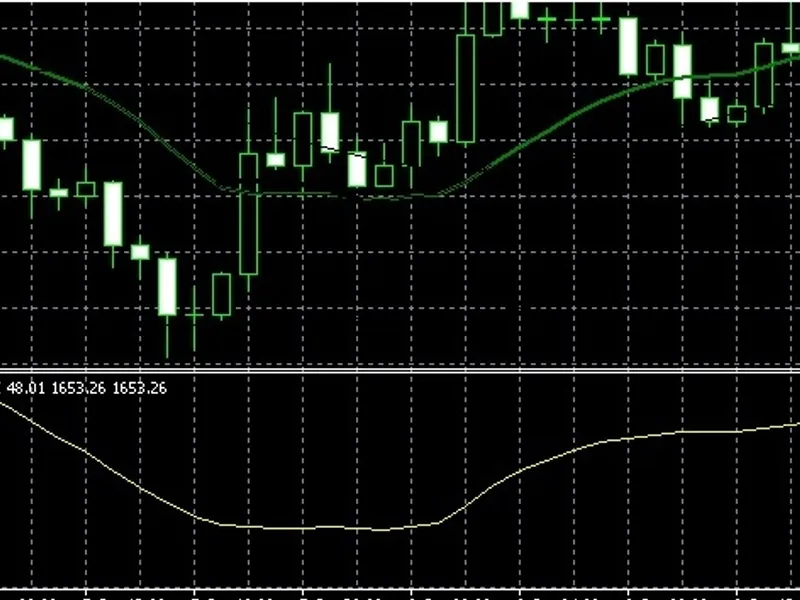
The indicator displays the actual range of the hourly candle in percent and the calculated range based on average statistics.
Indicator parameters:
Averaging Period
- averaging period for calculating the relative range indicator.
Number Of Bars For Statistics
- number of bars in history for collecting average statistics data for a trading instrument.
Shifting Start Of Statistics Calculation
- shift from which bar to start collecting statistics so that the readings do not affect the last N data.
Histogram Size
- histogram bar size (actual range).
Line Size
- line size (forecast range).
Histogram Color
- histogram color.
Line Color
- line color.How to understand the indicator readings:
1.
Histogram bars display the actual range of the H1 candle as a percentage (%).
2.
Line is the calculated value of the H1 candle range as a percentage (%) based on the average statistics.
!!! The indicator works only on the H1 chart period.