LB R Paint Bars
This is a powerful addition to your MetaTrader 5 toolkit designed to optimize market analysis and performance. This technical indicator acts as a specialized analysis tool designed to visualize market data. It helps traders identify emerging trends, momentum shifts, and key support or resistance levels by plotting statistical calculations directly onto price charts.
How to Setup and Use LB R Paint Bars
1. Installation: Place your file in the MQL/Indicators folder via "Open Data Folder" and restart your terminal.
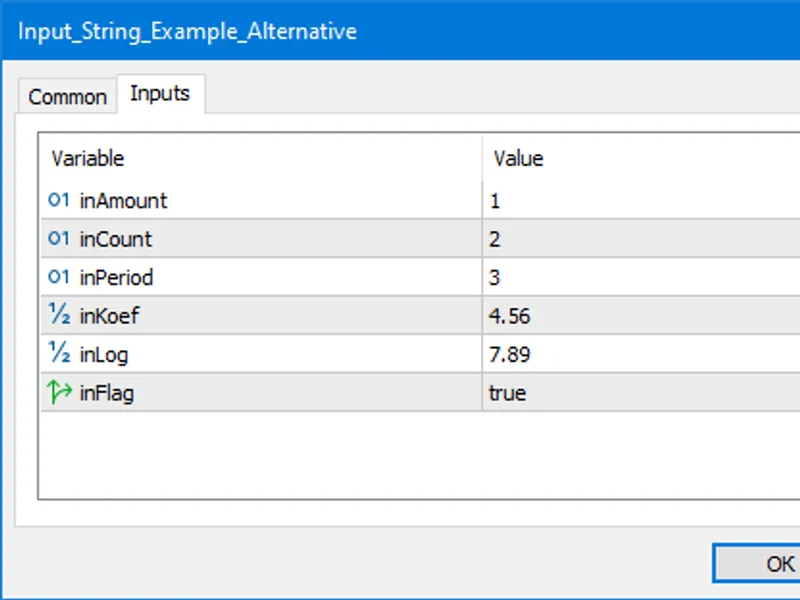
2. Loading: Find the indicator in the Navigator, drag it onto your chart, and configure the input parameters in the popup window.
3. Customization: Press Ctrl+I to open the indicator list, select your tool, and click "Properties" to change colors, levels, or visual styles.
4. Updating: Replace the old file in the Indicators folder with the new version and restart the platform to apply changes.
Frequently Asked Questions
Q: Why is my indicator not showing? A: Verify the file is in the MQL/Indicators folder, or try right-clicking the "Indicators" tree in the Navigator and clicking "Refresh."
Q: Do custom indicators slow down the platform? A: Too many complex indicators can impact performance; remove unused ones via the "Indicator List" (Ctrl+I).
Q: Can I use MT4 indicators on MT5? A: No, MQL4 and MQL5 are distinct languages; ensure the indicator is compiled specifically for your platform version.
Description & Settings
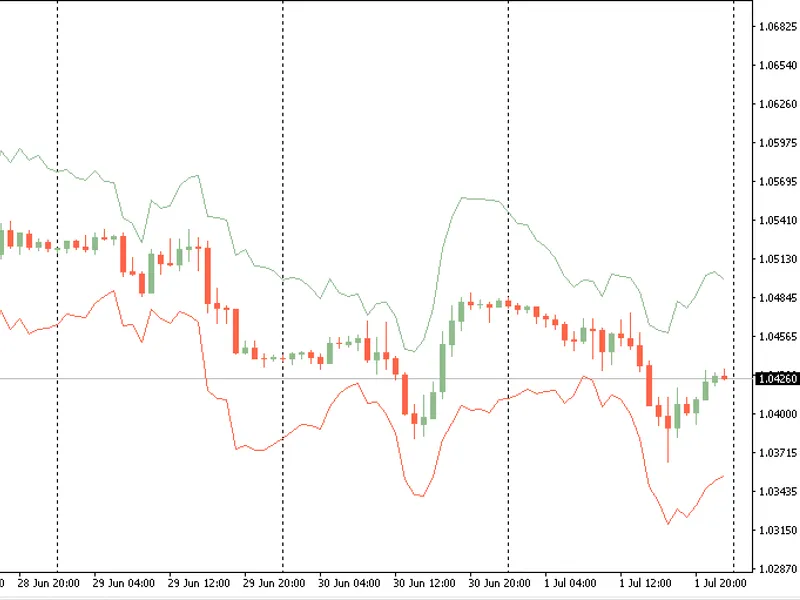
LBR Paint Bars indicator draws color candles depending on a trend direction. The trend is defined by the location of two volatility lines. A color cloud histogram is displayed along these two lines.
It has four inputs:
Factor
- ATR share in the cloud width calculation
ATR period
- ATR calculation period
HL period
- cloud borders calculation period
Color Candles
- display color candles (Yes/No)
Calculation:
where:
If color candles display is enabled (Color Candles = Yes):
if the bullish candle is closed above the cloud, a
green
candle is displayed
if the bearish candle is closed above the cloud, a
light-green
candle is displayed
if the bearish candle is closed below the cloud, a
red
candle is displayed
if the bullish candle is closed below the cloud, an
orange
candle is displayed