Kagi
This software component for MetaTrader 5 is built to enhance the capabilities of your trading environment. This technical indicator acts as a specialized analysis tool designed to visualize market data. It helps traders identify emerging trends, momentum shifts, and key support or resistance levels by plotting statistical calculations directly onto price charts.
How to Setup and Use Kagi
1. Installation: Place your file in the MQL/Indicators folder via "Open Data Folder" and restart your terminal.
2. Loading: Find the indicator in the Navigator, drag it onto your chart, and configure the input parameters in the popup window.
3. Customization: Press Ctrl+I to open the indicator list, select your tool, and click "Properties" to change colors, levels, or visual styles.
4. Updating: Replace the old file in the Indicators folder with the new version and restart the platform to apply changes.
Frequently Asked Questions
Q: Why is my indicator not showing? A: Verify the file is in the MQL/Indicators folder, or try right-clicking the "Indicators" tree in the Navigator and clicking "Refresh."
Q: Do custom indicators slow down the platform? A: Too many complex indicators can impact performance; remove unused ones via the "Indicator List" (Ctrl+I).
Q: Can I use MT4 indicators on MT5? A: No, MQL4 and MQL5 are distinct languages; ensure the indicator is compiled specifically for your platform version.
Description & Settings
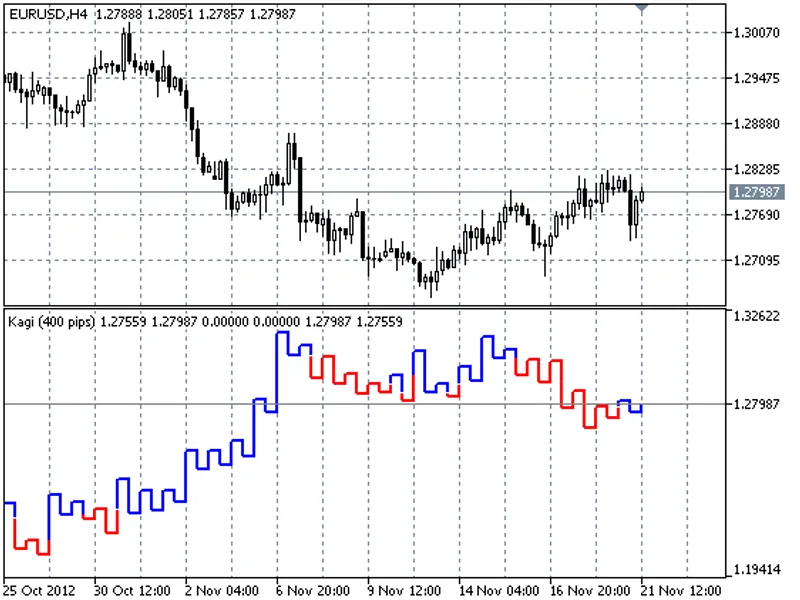
The Kagi chart is usually drawn on close prices and considers neither timeframe, nor volume. The idea is that if the market continues to move in the direction of the current Kagi line, the line is extended, and if the price goes in the opposite direction more than the set minimum reversal value then the line is drawn in the opposite direction. If there is breakthrough of the previous minimum (maximum) in the rollback then the line changes the color indicating about reversal.
Recommendations:
The very simple principle is to buy when "yang" (blue line), to sell when "yin" (red line).
After reversal wait for the confirmation in the form of a second vertical line of the same color in direction to a new trend.
A more detailed description of the Kagi charts and their use can be find in the book by Steve Nison "Beyond Candlesticks".