Jurik Volty Multi Timeframe
This tool for MetaTrader 5 is specifically engineered to streamline your trading operations. This technical indicator acts as a specialized analysis tool designed to visualize market data. It helps traders identify emerging trends, momentum shifts, and key support or resistance levels by plotting statistical calculations directly onto price charts.
How to Setup and Use Jurik Volty Multi Timeframe
1. Installation: Place your file in the MQL/Indicators folder via "Open Data Folder" and restart your terminal.
2. Loading: Find the indicator in the Navigator, drag it onto your chart, and configure the input parameters in the popup window.
3. Customization: Press Ctrl+I to open the indicator list, select your tool, and click "Properties" to change colors, levels, or visual styles.
4. Updating: Replace the old file in the Indicators folder with the new version and restart the platform to apply changes.
Frequently Asked Questions
Q: Why is my indicator not showing? A: Verify the file is in the MQL/Indicators folder, or try right-clicking the "Indicators" tree in the Navigator and clicking "Refresh."
Q: Do custom indicators slow down the platform? A: Too many complex indicators can impact performance; remove unused ones via the "Indicator List" (Ctrl+I).
Q: Can I use MT4 indicators on MT5? A: No, MQL4 and MQL5 are distinct languages; ensure the indicator is compiled specifically for your platform version.
Description & Settings
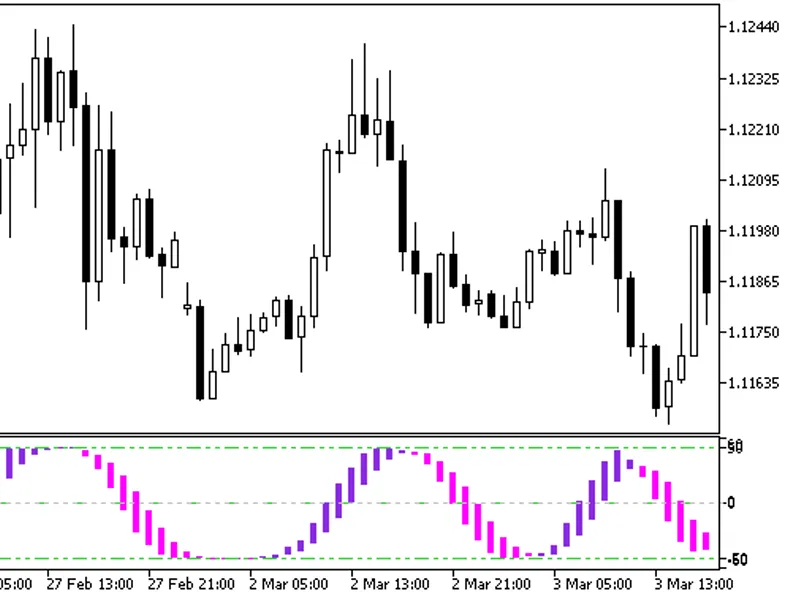
About Jurik smoothing there is one part that is less known: Jurik smoothing is adaptive indicator.
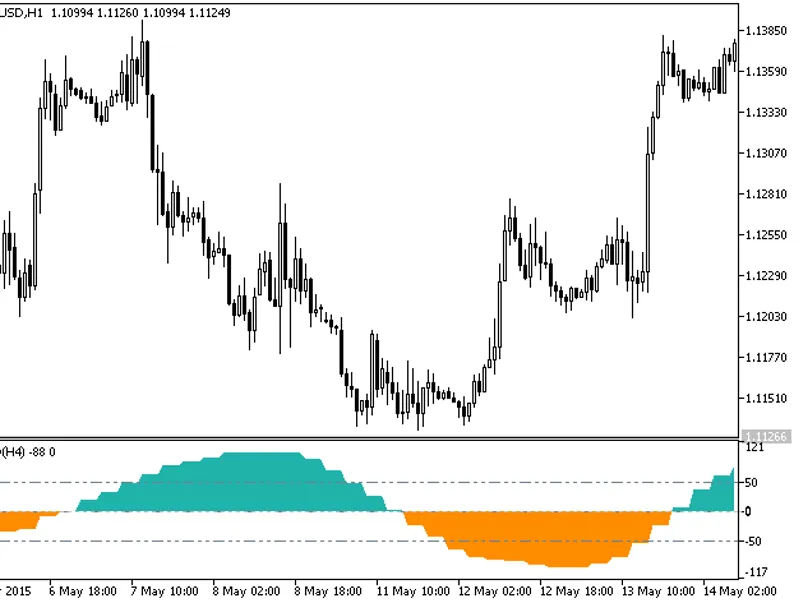
It is using something that is sometimes refereed to Jurik Volty (a sort of market volatility) for that adapting. This is the indicator that is calculating and showing periods of elevated or lesser volatility volatility as a standalone indicator. Parameters are simple:
Timeframe.
Volatility period.
Price.
Next higher timeframe: first higher timeframe compared to active chart.
Second higher timeframe: second higher timeframe compared to active chart.
Third higher timeframe: third higher timeframe compared to active chart.
If some of these 3 timeframes are used, then the timeframe is set automatically as you change the timeframe of the chart.
PS: do not forget that the indicator is not directional. The color change is showing periods of elevated or lessened than average volatility - not the expected direction of market prices.