Support and Resistance indicator for MQ L5
This professional-grade solution for MetaTrader 5 helps traders achieve greater efficiency in their daily workflow. This technical indicator acts as a specialized analysis tool designed to visualize market data. It helps traders identify emerging trends, momentum shifts, and key support or resistance levels by plotting statistical calculations directly onto price charts.
How to Setup and Use Support and Resistance indicator for MQ L5
1. Installation: Place your file in the MQL/Indicators folder via "Open Data Folder" and restart your terminal.
2. Loading: Find the indicator in the Navigator, drag it onto your chart, and configure the input parameters in the popup window.
3. Customization: Press Ctrl+I to open the indicator list, select your tool, and click "Properties" to change colors, levels, or visual styles.
4. Updating: Replace the old file in the Indicators folder with the new version and restart the platform to apply changes.
Frequently Asked Questions
Q: Why is my indicator not showing? A: Verify the file is in the MQL/Indicators folder, or try right-clicking the "Indicators" tree in the Navigator and clicking "Refresh."
Q: Do custom indicators slow down the platform? A: Too many complex indicators can impact performance; remove unused ones via the "Indicator List" (Ctrl+I).
Q: Can I use MT4 indicators on MT5? A: No, MQL4 and MQL5 are distinct languages; ensure the indicator is compiled specifically for your platform version.
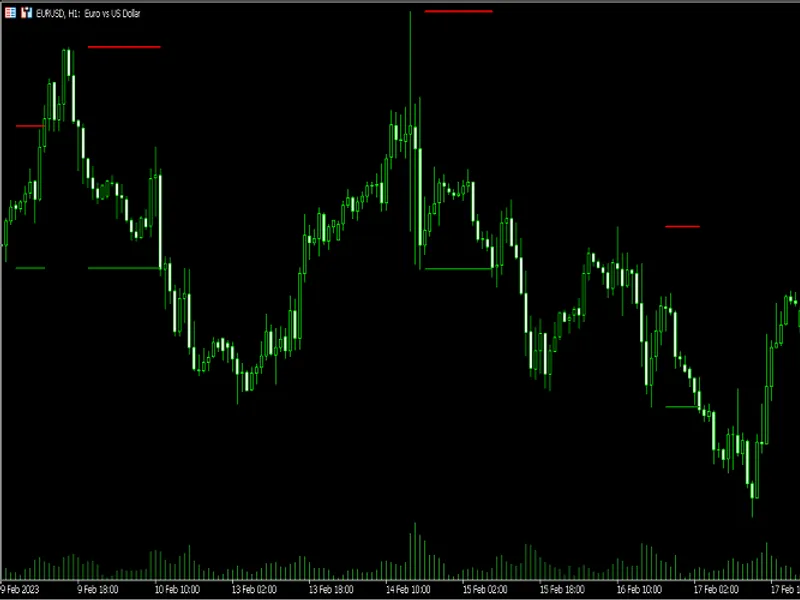
Description & Settings
The basic idea behind the indicator is to check for bouncebacks between support and resistance levels. There are two input parameters: period and overlook. A support level is the lowest low in the last period bars if this value is equal to the lowest low of the last period+overlook bars. A resistance level is the highest high in the last period bars if it is equal to the highest high of the last period+overlook bars. If there are both support and resistance levels and a bounceback happens (price is between these levels) the support and resistance levels will be displayed on the chart.
In the original Indicator the i integer runs from period+overlook until rates_total, so the for cycle is for(i = rates_total-3;i<rates_total;i++). But for some reason I had to change that to validate my code.