Price Percentage Zigzag (No timeframes)
This software component for MetaTrader 5 is built to enhance the capabilities of your trading environment. This technical indicator acts as a specialized analysis tool designed to visualize market data. It helps traders identify emerging trends, momentum shifts, and key support or resistance levels by plotting statistical calculations directly onto price charts.
How to Setup and Use Price Percentage Zigzag (No timeframes)
1. Installation: Place your file in the MQL/Indicators folder via "Open Data Folder" and restart your terminal.
2. Loading: Find the indicator in the Navigator, drag it onto your chart, and configure the input parameters in the popup window.
3. Customization: Press Ctrl+I to open the indicator list, select your tool, and click "Properties" to change colors, levels, or visual styles.
4. Updating: Replace the old file in the Indicators folder with the new version and restart the platform to apply changes.
Frequently Asked Questions
Q: Why is my indicator not showing? A: Verify the file is in the MQL/Indicators folder, or try right-clicking the "Indicators" tree in the Navigator and clicking "Refresh."
Q: Do custom indicators slow down the platform? A: Too many complex indicators can impact performance; remove unused ones via the "Indicator List" (Ctrl+I).
Q: Can I use MT4 indicators on MT5? A: No, MQL4 and MQL5 are distinct languages; ensure the indicator is compiled specifically for your platform version.
Description & Settings
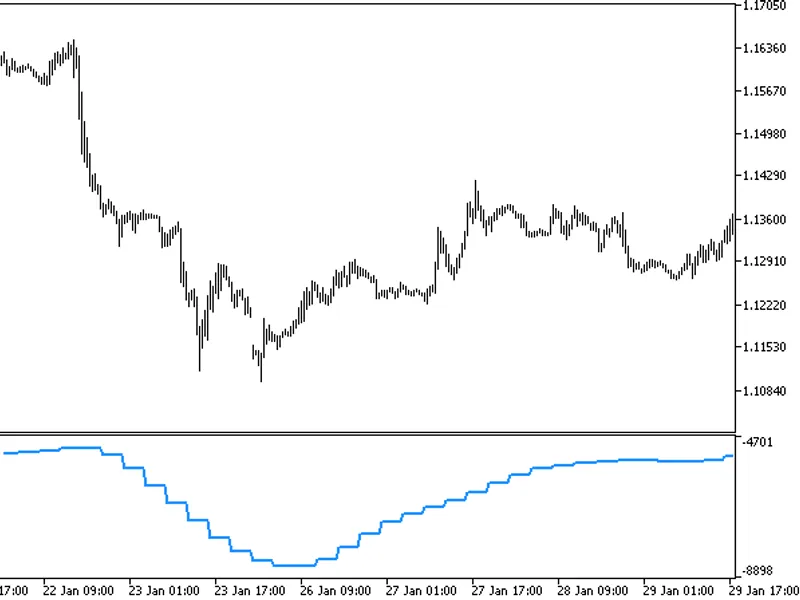
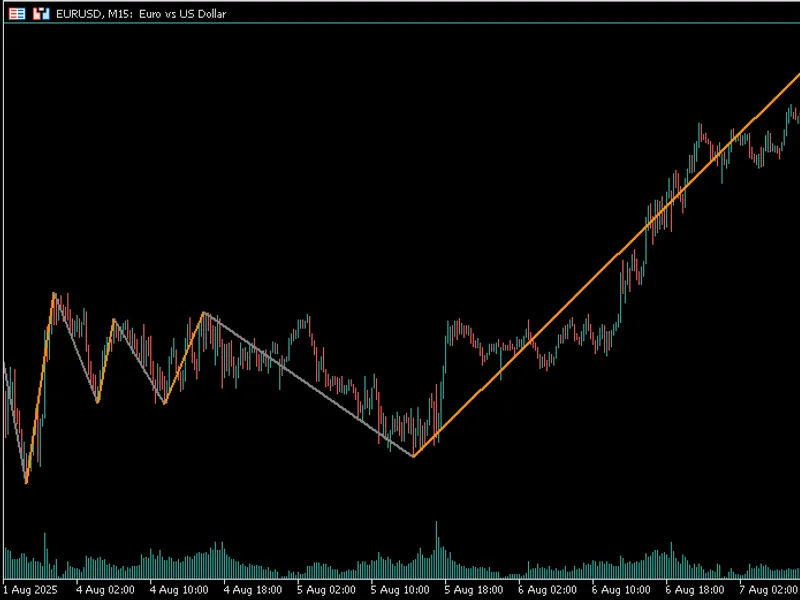
This is a zigzag which is not warped by timeframes, and the leg changes based on asset price percentage change from the extremums. The zigzag is strictly based on price, and does not consider time.
The clean and thoughtful zigzag structure is credited to Evgeniy Chumakov and so he is linked in the code as it is his code structure that was seen in his MQL4 "Autoscale zigzag".
As it is a zigzag indicator, it's not appropriate to use this as a standalone tool for trade decisions. Instead, you could use it to police the trend like in a Renko chart, and potentially combine it with a momentum oscillator to figure out when and where it may be appropriate to make an entry.