HT F Reversal Divergences
This is a powerful addition to your MetaTrader 5 toolkit designed to optimize market analysis and performance. This technical indicator acts as a specialized analysis tool designed to visualize market data. It helps traders identify emerging trends, momentum shifts, and key support or resistance levels by plotting statistical calculations directly onto price charts.
How to Setup and Use HT F Reversal Divergences
1. Installation: Place your file in the MQL/Indicators folder via "Open Data Folder" and restart your terminal.
2. Loading: Find the indicator in the Navigator, drag it onto your chart, and configure the input parameters in the popup window.
3. Customization: Press Ctrl+I to open the indicator list, select your tool, and click "Properties" to change colors, levels, or visual styles.
4. Updating: Replace the old file in the Indicators folder with the new version and restart the platform to apply changes.
Frequently Asked Questions
Q: Why is my indicator not showing? A: Verify the file is in the MQL/Indicators folder, or try right-clicking the "Indicators" tree in the Navigator and clicking "Refresh."
Q: Do custom indicators slow down the platform? A: Too many complex indicators can impact performance; remove unused ones via the "Indicator List" (Ctrl+I).
Q: Can I use MT4 indicators on MT5? A: No, MQL4 and MQL5 are distinct languages; ensure the indicator is compiled specifically for your platform version.
Description & Settings
This indicator combines two powerful analytical tools into a single overlay:
RSI divergence detection
and a
Higher Timeframe (HTF) Power of 3 (PO3) candle projection
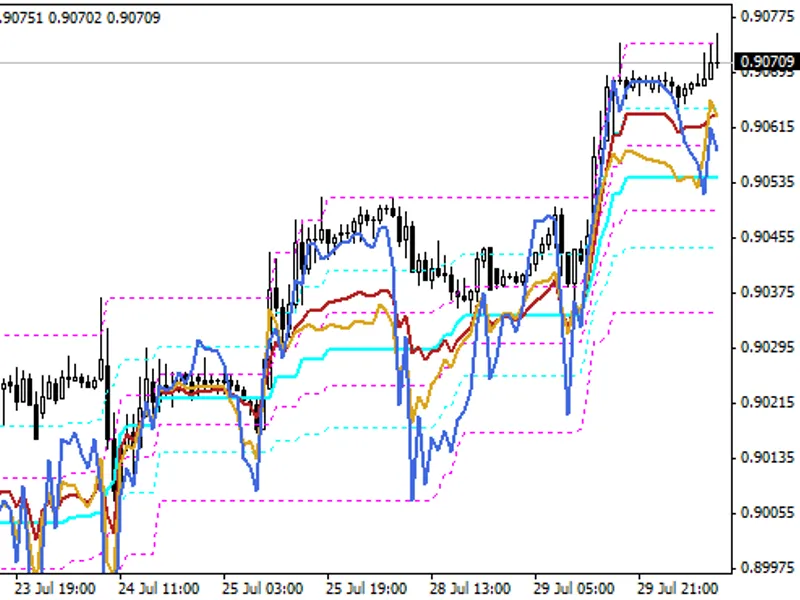
. Divergences between price action and the RSI are one of the most reliable early warning signs of a potential trend reversal. When price makes a new low while RSI makes a higher low, a bullish reversal becomes probable. When price makes a new high while RSI makes a lower high, a bearish reversal is likely. This indicator automates that detection across all historical bars and continues to monitor in real time, marking every confirmed divergence with trend lines on both the main chart and the RSI subwindow.
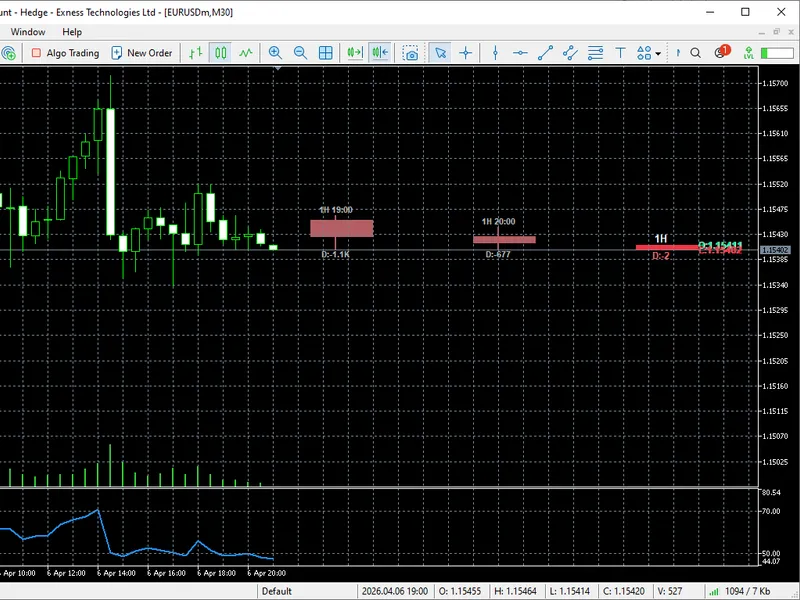
In addition to divergence detection, the indicator renders a live candle projection panel to the right of the last chart bar. This panel displays the most recent closed candles from a user-selected higher timeframe, alongside the currently forming live HTF candle. Each projected candle shows its Open, High, Low, and Close values along with a signed
Delta
(tick volume with direction), giving traders an at-a-glance view of HTF momentum without switching charts. Historical candles are rendered in a muted gray tone to visually distinguish them from the live candle, which is displayed in full color.
The indicator also includes a built-in
signal filter system
that combines RSI level thresholds, HTF candle direction, and Delta direction to qualify divergence signals. Only divergences that pass all active filters produce a colored arrow on the chart and update the on-chart
dashboard panel
. The dashboard displays the current symbol and timeframe, HTF candle direction, live RSI reading, live Delta reading, and the last confirmed signal with its timestamp. Optional pop-up alerts notify the trader when a fresh bullish or bearish divergence forms on the current bar. All drawn objects are cleanly removed when the indicator is removed from the chart.
Input Parameters