


GM M A
Info
The GM M A is a Indicator for MetaTrader 5 that guppy multiple moving average (gmma) is an indicator based on the relationships between groups of. Each group of moving averages in GMMA indicator provides insight into the behavior of two dominant market groups - traders and investors.
Usage
This tool is typically used for enhancing chart analysis and decision making.
Platform
This Indicator works exclusively on MetaTrader 5 (both build 600+ and newer versions).
Setup
Place the downloaded file in MQL5/Indicators folder via File ? Open Data Folder in MetaTrader 5.
How to Install and Use GM M A
1. Installation: Place your file in the MQL/Indicators folder via "Open Data Folder" and restart your terminal.
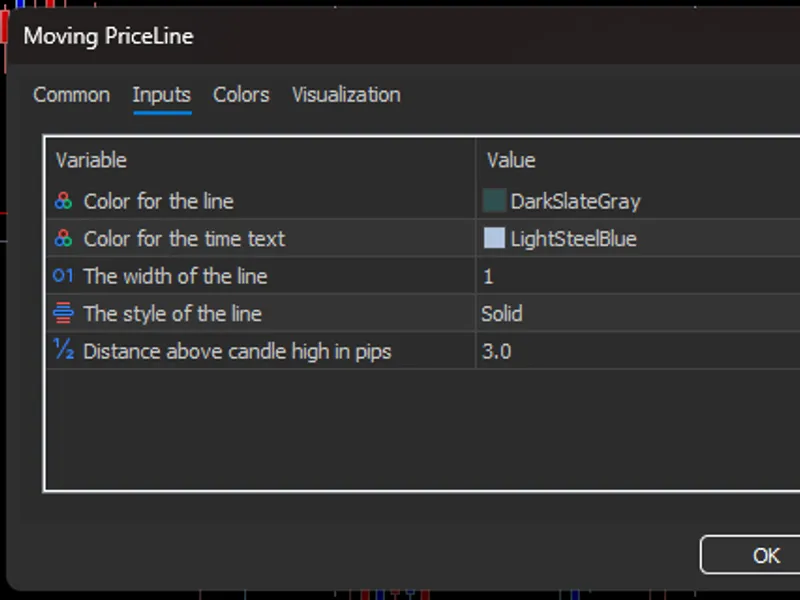
2. Loading: Find the indicator in the Navigator, drag it onto your chart, and configure the input parameters in the popup window.
3. Customization: Press Ctrl+I to open the indicator list, select your tool, and click "Properties" to change colors, levels, or visual styles.
4. Updating: Replace the old file in the Indicators folder with the new version and restart the platform to apply changes.
Frequently Asked Questions
Q: Why is my indicator not showing? A: Verify the file is in the MQL/Indicators folder, or try right-clicking the "Indicators" tree in the Navigator and clicking "Refresh."
Q: Do custom indicators slow down the platform? A: Too many complex indicators can impact performance; remove unused ones via the "Indicator List" (Ctrl+I).
Q: Can I use MT4 indicators on MT5? A: No, MQL4 and MQL5 are distinct languages; ensure the indicator is compiled specifically for your platform version.
What this tool does
Guppy Multiple Moving Average (GMMA) is an indicator based on the relationships between groups of.
Typical Use Case
This Indicator excels in automated trading and technical analysis on MetaTrader 5.
Compatible Platform & Setup
This Indicator works on MetaTrader 5. Place the file in the MQL5/Indicators folder and restart the terminal.
Description & Settings
Related: Price Channel - another powerful indicator for MetaTrader 5 traders.
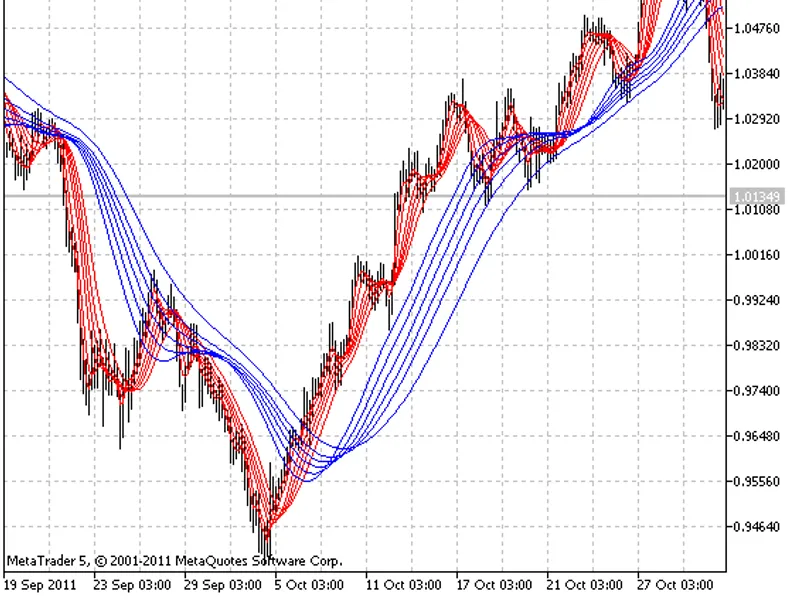
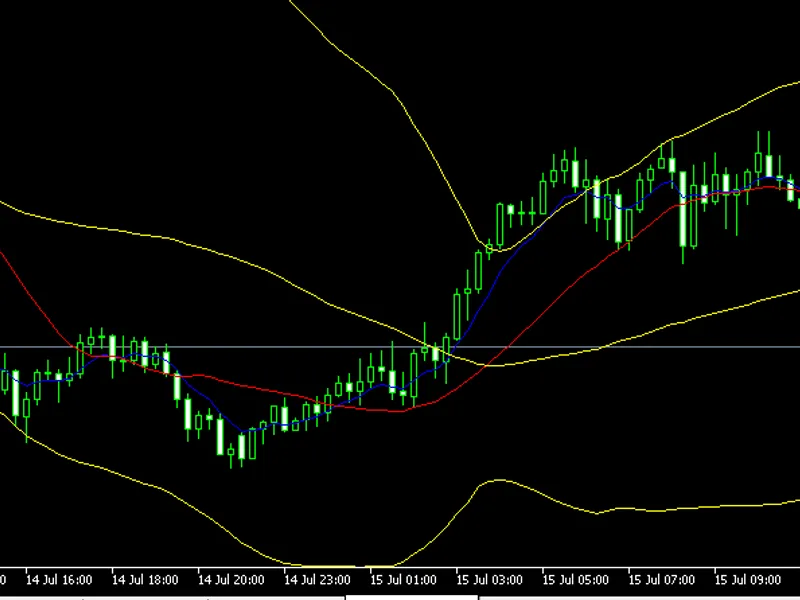
Guppy Multiple Moving Average (GMMA) is an indicator based on the relationships between groups of . Each group of moving averages in GMMA indicator provides insight into the behavior of two dominant market groups - traders and investors. This indicator allows a trader to understand market relationships shown on the chart and thus choose the most appropriate trading methods and tools. GMMA indicator is designed to understand the nature of the trend movement on a daily or intraday basis.
Also recommended: Multi-Timeframe Moving Average Indicator (v03) - similar indicator with strong performance on MetaTrader 5.
Implied traders activity is tracked by using a group of short-term moving averages. Traders always start a trend change. Their actions push prices upwards in anticipation of a trend change from downward to upward one. Their activity is displayed in a group of 3-, 5-, 8-, 10-, 12- and 15-period exponential moving averages.The trend continues, only if other buyers also enter the market. Strong trends are supported by long-term investors. Investors require more time to recognize a trend change, but they always follow the traders. We track the implied investors activity, using a group of long-term moving averages. This group includes 30-, 35-, 40-, 45-, 50- and 60-period exponential moving averages.
GMMA indicator used in six trading situations:
Standard trend breakouts;
Joining the trend;
Using price weakness;
Rally and trend brekout;
Choosing the best exit;
Trading bubbles.
- simple moving average;
- exponential moving average;
- smoothed moving average;
- linear weighted moving average;
- JMA adaptive average;
- ultralinear smoothing;
- parabolic smoothing;
- Tillson's multiple exponential smoothing;
- smoothing with the use of Tushar Chande's algorithm;
- smoothing with the use of Perry Kaufman's algorithm.
It should be noted that Phase1 and Phase2 parameters have completely different meaning for different smoothing algorithms. For JMA it is an external Phase variable changing from -100 to +100. For T3 it is a smoothing ratio multiplied by 100 for better visualization, for VIDYA it is a CMO oscillator period and for AMA it is a slow EMA period. In other algorithms these parameters do not affect smoothing. For AMA fast EMA period is a fixed value and is equal to 2 by default. The ratio of raising to the power is also equal to 2 for AMA.
The indicator uses SmoothAlgorithms.mqh library classes (must be copied to the terminal_data_folder\MQL5\Include). The use of the classes was thoroughly described in the article .
Indicator input parameters:
You may also like: Multi-Timeframe Relative Strength Index (MTF RSI) Indicator for MT4/MT5 - excellent alternative for indicator users on MetaTrader 5.
⚠ Limitations & Risk Warning
- This tool is provided for educational and testing purposes only.
- Past performance does not guarantee future results.
- Trading involves substantial risk of loss. Use on a demo account first.
- Results may vary depending on market conditions, broker, and settings.
- We recommend thorough backtesting and forward testing before using with real funds.