Glitch Index
This professional-grade solution for MetaTrader 5 helps traders achieve greater efficiency in their daily workflow. This technical indicator acts as a specialized analysis tool designed to visualize market data. It helps traders identify emerging trends, momentum shifts, and key support or resistance levels by plotting statistical calculations directly onto price charts.
How to Setup and Use Glitch Index
1. Installation: Place your file in the MQL/Indicators folder via "Open Data Folder" and restart your terminal.
2. Loading: Find the indicator in the Navigator, drag it onto your chart, and configure the input parameters in the popup window.
3. Customization: Press Ctrl+I to open the indicator list, select your tool, and click "Properties" to change colors, levels, or visual styles.
4. Updating: Replace the old file in the Indicators folder with the new version and restart the platform to apply changes.
Frequently Asked Questions
Q: Why is my indicator not showing? A: Verify the file is in the MQL/Indicators folder, or try right-clicking the "Indicators" tree in the Navigator and clicking "Refresh."
Q: Do custom indicators slow down the platform? A: Too many complex indicators can impact performance; remove unused ones via the "Indicator List" (Ctrl+I).
Q: Can I use MT4 indicators on MT5? A: No, MQL4 and MQL5 are distinct languages; ensure the indicator is compiled specifically for your platform version.
Description & Settings
Source of this on is February 2004, Active Trader magazine.
System concept
This system was inspired by the more successful stock systems that have appeared in the Trading System Lab. These strategies share a common timing technique - they attempt to take advantage of minor extreme price movements.
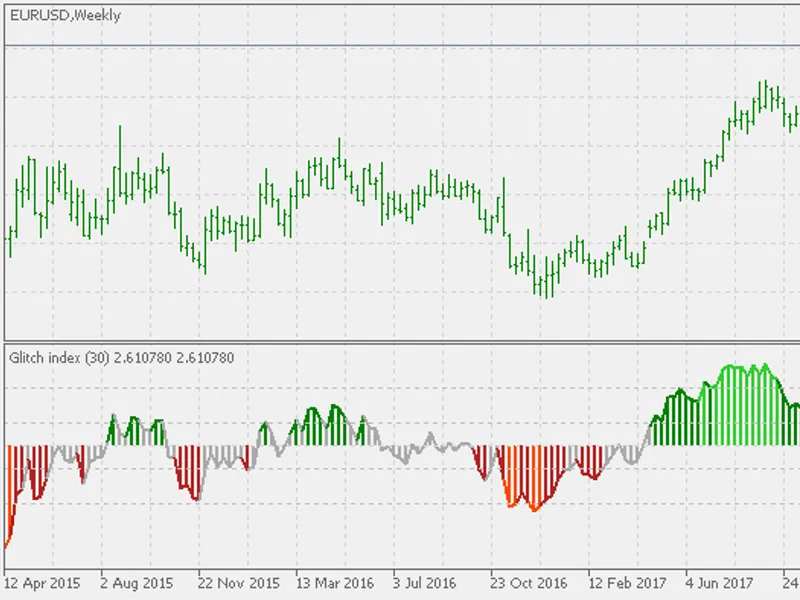
This system detects when price has deviated significantly from its norm by measuring how far it moves above and below a "detrended" Simple Moving Average (SMA). The resulting indicator is called the "Glitch Index," which represents the percentage move price has made above or below the detrended SMA. The theory is price will move back to its norm, and we can profit by taking advantage of the temporary deviation.
The formula for calculating the Glitch Index is:
Glitch Index = (Diff/Closing Price) * 100
where:
SMA = 30-period Simple Moving Average Diff = Closing Price - SMAMult RocSMA = Rate of Change(SMA) * 0.1 + 1 SMAMult = SMA* RocSMA
The system buys when the Glitch Index goes below -2 and sells when it swings back up above +2. However, the system will not enter a long trade if the highest Glitch Index value within a 30-bar period is greater than 5. This prevents the system from entering when prices snap back from an extremely overbought level, such as a blow-off at the top of a strong bull rally.
The color of the Glitch Index (GI) indicator bars helps illustrate what the system is doing.
Light green bars indicate a GI greater than 5, which means long trades are forbidden for the next 30 bars even if an entry signal occurs.
Dark green bars indicate a GI of greater than 2 (the sell zone).
Red bars indicate areas that are within the "no sell" zone (GI < -5).
Dark red bars indicate the buy zone (i.e., GI < -2).
The system does not sell short.
Entry
The Glitch Index must be less than -2.
The highest Glitch Index reading within the last 30 bars must be less than +5.
If these two conditions are met, buy the next bar at the market. Exit
If the Glitch Index is greater than +2, exit next bar at the market. Money management
Each trade was sized to equal 6 percent of the current account equity.
PS: the system is designed for daily and weekly time frames. For lower time frames the levels have to be adjusted.