Fractal Dimension Index
This is a powerful addition to your MetaTrader 5 toolkit designed to optimize market analysis and performance. This technical indicator acts as a specialized analysis tool designed to visualize market data. It helps traders identify emerging trends, momentum shifts, and key support or resistance levels by plotting statistical calculations directly onto price charts.
How to Setup and Use Fractal Dimension Index
1. Installation: Place your file in the MQL/Indicators folder via "Open Data Folder" and restart your terminal.
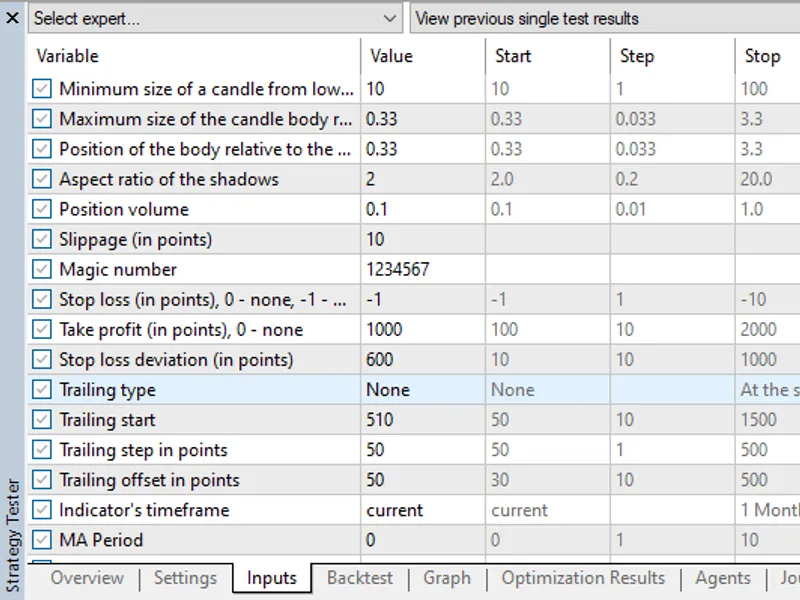
2. Loading: Find the indicator in the Navigator, drag it onto your chart, and configure the input parameters in the popup window.
3. Customization: Press Ctrl+I to open the indicator list, select your tool, and click "Properties" to change colors, levels, or visual styles.
4. Updating: Replace the old file in the Indicators folder with the new version and restart the platform to apply changes.
Frequently Asked Questions
Q: Why is my indicator not showing? A: Verify the file is in the MQL/Indicators folder, or try right-clicking the "Indicators" tree in the Navigator and clicking "Refresh."
Q: Do custom indicators slow down the platform? A: Too many complex indicators can impact performance; remove unused ones via the "Indicator List" (Ctrl+I).
Q: Can I use MT4 indicators on MT5? A: No, MQL4 and MQL5 are distinct languages; ensure the indicator is compiled specifically for your platform version.
Description & Settings
iliko
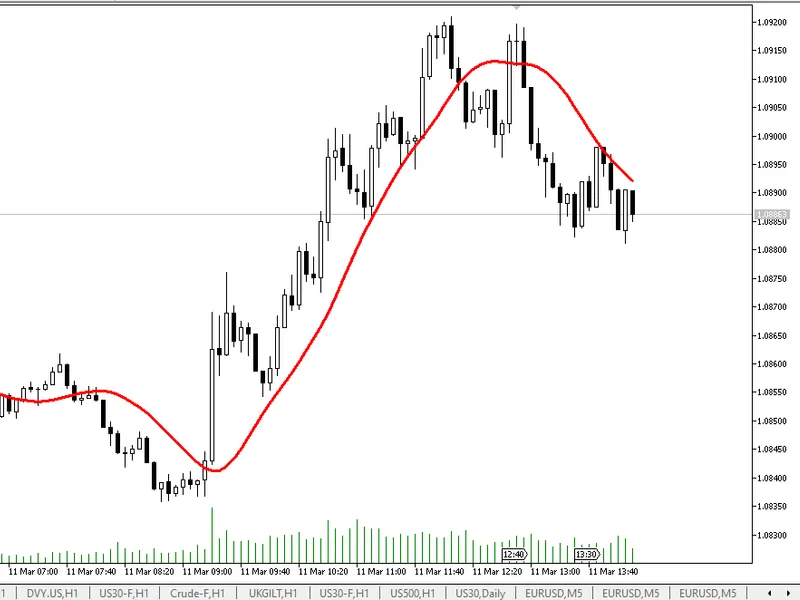
The Fractal Dimension Index determines the amount of market volatility.
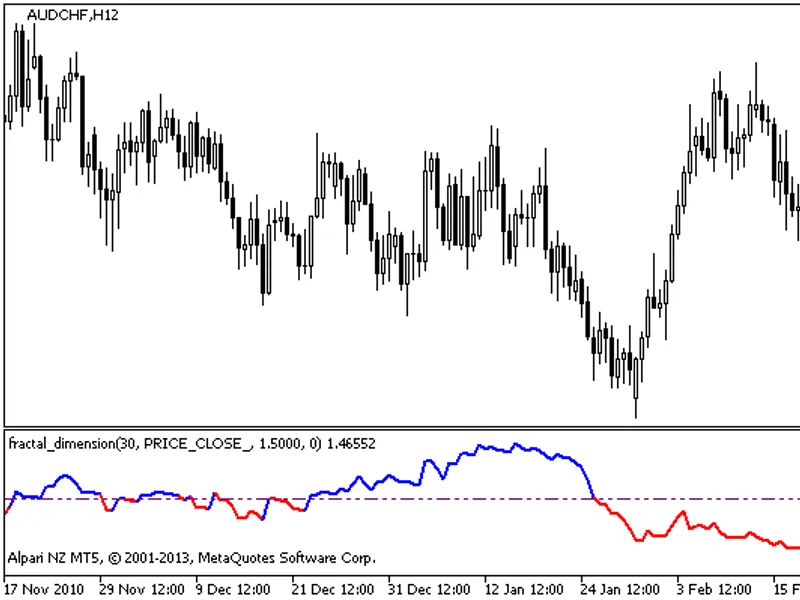
The easiest way to use this indicator is to understand that a value of 1.5 suggests the market is acting in a completely random fashion. Deviation from 1.5 indicates a possible profit. The possibility of profit increases when deviation increases. However, be careful - the indicator does not show trend direction! In the state of trend the indicator appears red. With high volatility it is blue. Color change from red to blue means the end of the trend, the market becomes chaotic and volatility increases. Typically, these moments are not long and are followed by a new trend.
Indicator triggering is defined by the value of the following input parameter:
Originally this indicator has been written in MQL4 and was first published in the on 24.01.2008.
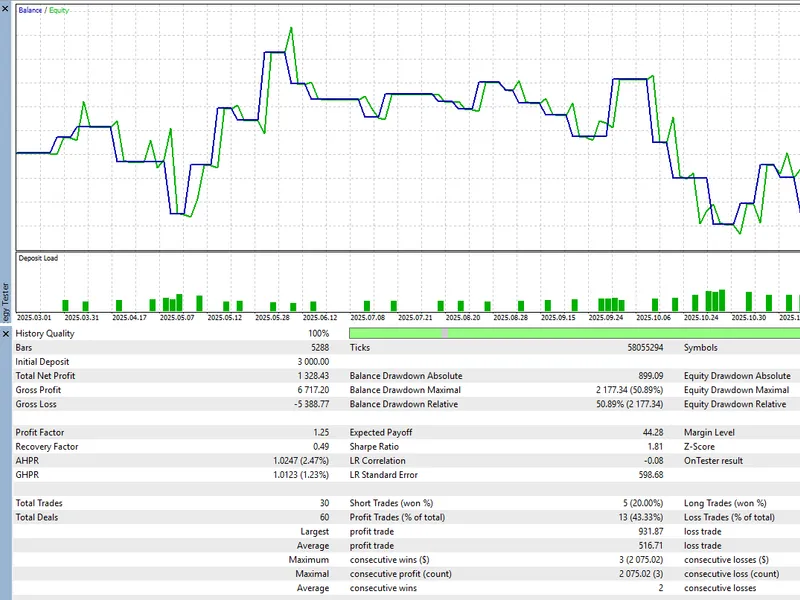
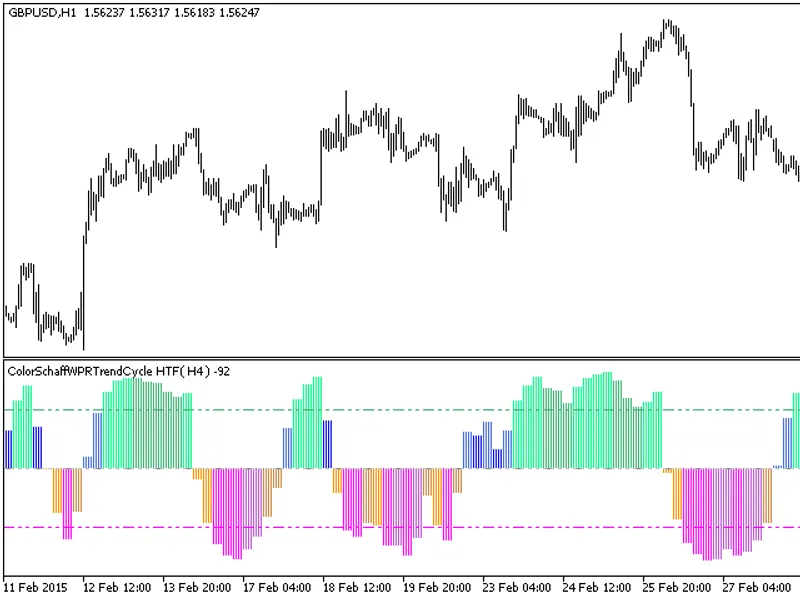
Figure 1. Fractal Dimension Index