Fractal Adaptive Moving Average (Fr AM A)
This is a powerful addition to your MetaTrader 5 toolkit designed to optimize market analysis and performance. This technical indicator acts as a specialized analysis tool designed to visualize market data. It helps traders identify emerging trends, momentum shifts, and key support or resistance levels by plotting statistical calculations directly onto price charts.
How to Setup and Use Fractal Adaptive Moving Average (Fr AM A)
1. Installation: Place your file in the MQL/Indicators folder via "Open Data Folder" and restart your terminal.
2. Loading: Find the indicator in the Navigator, drag it onto your chart, and configure the input parameters in the popup window.
3. Customization: Press Ctrl+I to open the indicator list, select your tool, and click "Properties" to change colors, levels, or visual styles.
4. Updating: Replace the old file in the Indicators folder with the new version and restart the platform to apply changes.
Frequently Asked Questions
Q: Why is my indicator not showing? A: Verify the file is in the MQL/Indicators folder, or try right-clicking the "Indicators" tree in the Navigator and clicking "Refresh."
Q: Do custom indicators slow down the platform? A: Too many complex indicators can impact performance; remove unused ones via the "Indicator List" (Ctrl+I).
Q: Can I use MT4 indicators on MT5? A: No, MQL4 and MQL5 are distinct languages; ensure the indicator is compiled specifically for your platform version.
Description & Settings
Fractal Adaptive Moving Average technical Indicator (FRAMA) was developed by John Ehlers.
This indicator is constructed based on the algorithm of the Exponential Moving Average, in which the smoothing factor is calculated based on the current fractal dimension of the price series. The advantage of FRAMA is the possibility to follow strong trend movements and to sufficiently slow down at the moments of price consolidation.
All types of analysis used for Moving Averages can be applied to this indicator.
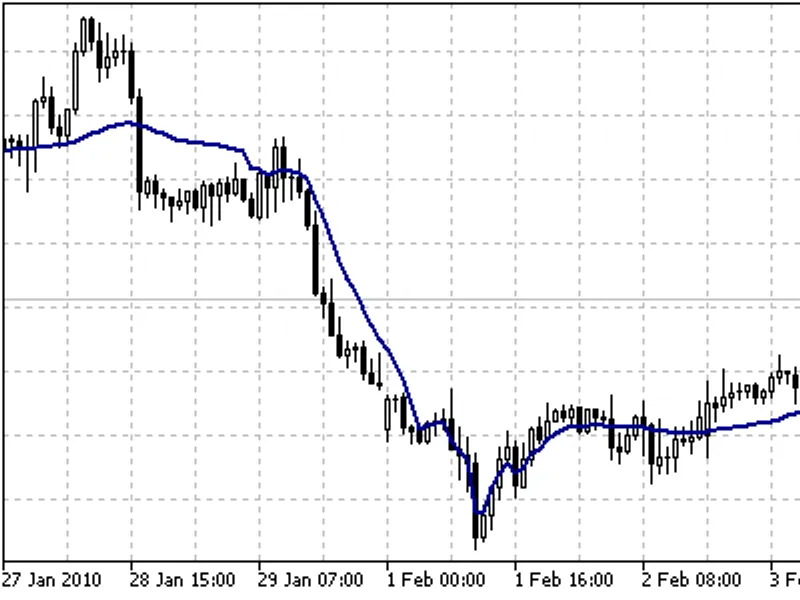
Fractal Adaptive Moving Average Indicator
Calculation:
FRAMA(i) = A(i) * Price(i) + (1 - A(i)) * FRAMA(i-1)
where:
FRAMA(i) - current value of FRAMA;
Price(i) - current price;
FRAMA(i-1) - previous value of FRAMA;
A(i) - current factor of exponential smoothing.
Exponential smoothing factor is calculated according to the below formula:
A(i) = EXP(-4.6 * (D(i) - 1))
where:
D(i) - current fractal dimension;
EXP() - mathematical function of exponent.
Fractal dimension of a straight line is equal to one. It is seen from the formula that if D = 1, then A = EXP(-4.6 *(1-1)) = EXP(0) = 1. Thus if price changes in straight lines, exponential smoothing is not used, because in such a case the formula looks like this:
FRAMA(i) = 1 * Price(i) + (1 - i) * FRAMA(i-1) = Price(i)
I.e. the indicator exactly follows the price.
The fractal dimension of a plane is equal to two. From the formula we get that if D = 2, then the smoothing factor A = EXP(-4.6*(2-1)) = EXP(-4.6) = 0.01. Such a small value of the exponential smoothing factor is obtained at moments when price makes a strong saw-toothed movement. Such a strong slow-down corresponds to approximately 200-period simple moving average.
Formula of fractal dimension:
D = (LOG(N1 + N2) - LOG(N3))/LOG(2)
It is calculated based on the additional formula:
N(Length,i) = (HighestPrice(i) - LowestPrice(i))/Length
where:
HighestPrice(i) - current maximal value for Length periods;
LowestPrice(i) - current minimal value for Length periods;
Values N1, N2 and N3 are respectively equal to:
N1(i) = N(Length,i)N2(i) = N(Length,i + Length)N3(i) = N(2 * Length,i)