
Fisher Transform Indicator: A Statistical Approach to Price Oscillation
Info
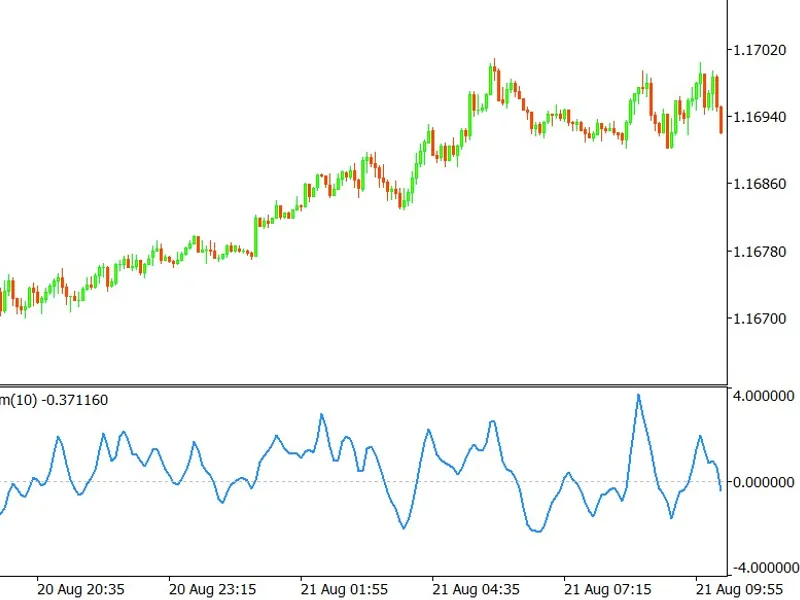
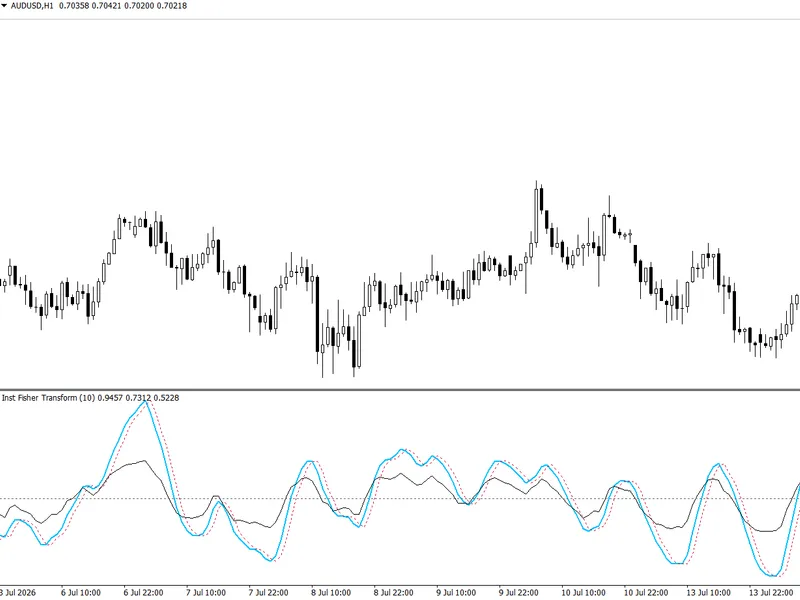
The Fisher Transform Indicator: A Statistical Approach to Price Oscillation is a Indicator for MetaTrader 5 that a complete fisher transform oscillator for metatrader 5, built from statistical first principles rather than adapted from an existing template. The indicator applies a technique originally developed in statistics by Ronald Fisher — used to reshape a bounded, non-normal set of values into one that closely approximates a normal distribution — to price data, producing turning points that are noticeably sharper and more clearly defined than those from conventional oscillators built on simple averaging.
Usage
This tool is typically used for enhancing chart analysis and decision making.
Platform
This Indicator works exclusively on MetaTrader 5 (both build 600+ and newer versions).
Setup
Place the downloaded file in MQL5/Indicators folder via File ? Open Data Folder in MetaTrader 5.
How to Install and Use Fisher Transform Indicator: A Statistical Approach to Price Oscillation
1. Installation: Place your file in the MQL/Indicators folder via "Open Data Folder" and restart your terminal.
2. Loading: Find the indicator in the Navigator, drag it onto your chart, and configure the input parameters in the popup window.
3. Customization: Press Ctrl+I to open the indicator list, select your tool, and click "Properties" to change colors, levels, or visual styles.
4. Updating: Replace the old file in the Indicators folder with the new version and restart the platform to apply changes.
Frequently Asked Questions
Q: Why is my indicator not showing? A: Verify the file is in the MQL/Indicators folder, or try right-clicking the "Indicators" tree in the Navigator and clicking "Refresh."
Q: Do custom indicators slow down the platform? A: Too many complex indicators can impact performance; remove unused ones via the "Indicator List" (Ctrl+I).
Q: Can I use MT4 indicators on MT5? A: No, MQL4 and MQL5 are distinct languages; ensure the indicator is compiled specifically for your platform version.
What this tool does
A complete Fisher Transform oscillator for MetaTrader 5, built from statistical first principles rather than adapted from an existing template.
Typical Use Case
This Indicator excels in automated trading and technical analysis on MetaTrader 5.
Compatible Platform & Setup
This Indicator works on MetaTrader 5. Place the file in the MQL5/Indicators folder and restart the terminal.
Description & Settings
Related: multi-mode logarithmic transform indicator - another powerful indicator for MetaTrader 5 traders.
A complete Fisher Transform oscillator for MetaTrader 5, built from statistical first principles rather than adapted from an existing template.Also recommended: Fisher Cyber Cycle Indicator - similar indicator with strong performance on MetaTrader 5.
The indicator applies a technique originally developed in statistics by Ronald Fisher — used to reshape a bounded, non-normal set of values into one that closely approximates a normal distribution — to price data, producing turning points that are noticeably sharper and more clearly defined than those from conventional oscillators built on simple averaging.The calculation happens in three stages.
Price is first normalized into a fixed range based on its recent highs and lows, similar in spirit to a stochastic-style calculation.
That normalized value is then smoothed against its own previous value and clamped just short of its theoretical boundary, since the next step involves a logarithm that approaches infinity as its input approaches that boundary.
Finally, the bounded value is passed through the logarithmic Fisher Transform itself and blended recursively with the previous bar's output — which is what gives the indicator its ability to make extremes and reversals stand out sharply, rather than blending into the normal back-and-forth of price.
Internal recursive state is handled through a properly registered calculation buffer rather than a manually-managed array, which hands its sizing and bar-to-bar continuity over to the terminal automatically.
The main output buffer itself doubles as its own recursive memory, since it holds a continuous value on every bar with no gaps — an efficiency that avoids storing the same information twice under different names.
The indicator deliberately outputs a single, honest oscillator value with no built-in buy/sell arrows; deciding when a reading counts as a signal is left to the trader or to a companion Expert Advisor.
How to Use It:
Reading this indicator means watching two things together: the level the Fisher line reaches, and what it does after reaching that level.
A reading beyond roughly ±1.5 to ±2 represents a meaningful extreme relative to the recent range — the higher the threshold, the fewer but stronger the signals.
The actionable moment is not when the line first crosses that threshold; it's when the line reaches beyond it and then turns back toward zero.
A value climbing steadily past +2 is still in an active move — the peak, where it stops climbing and starts descending, is what marks a potential sell opportunity.
The same logic applies in reverse for a trough below the lower threshold, marking a potential buy opportunity.
This two-part condition — reach an extreme, then confirm a reversal — is deliberately stricter than a simple threshold crossing, and is the same rule a companion Expert Advisor can apply programmatically.
This indicator was built and reviewed as part of the "Making Custom Indicators for Beginners" article series, where the full statistical theory, implementation walkthrough, and threshold-based usage guide are explained in detail.
It is provided here as a clean, standalone Fisher Transform implementation suitable for direct use or as a reference for anyone building their own statistically-grounded oscillators in MQL5.
You may also like: Fisher CG Oscillator - excellent alternative for indicator users on MetaTrader 5.
Source Code
#property copyright "RobotFX"
#property version     "2.00"
#property strict
#property indicator_separate_window
#property indicator_buffers 2
#property indicator_plots   1
#property indicator_minimum -4
#property indicator_maximum 4
#property indicator_level1  0.0
#property indicator_levelstyle STYLE_DOT
.......
⚠ Limitations & Risk Warning
- This tool is provided for educational and testing purposes only.
- Past performance does not guarantee future results.
- Trading involves substantial risk of loss. Use on a demo account first.
- Results may vary depending on market conditions, broker, and settings.
- We recommend thorough backtesting and forward testing before using with real funds.