Extrapolator
This software component for MetaTrader 5 is built to enhance the capabilities of your trading environment. This technical indicator acts as a specialized analysis tool designed to visualize market data. It helps traders identify emerging trends, momentum shifts, and key support or resistance levels by plotting statistical calculations directly onto price charts.
How to Setup and Use Extrapolator
1. Installation: Place your file in the MQL/Indicators folder via "Open Data Folder" and restart your terminal.
2. Loading: Find the indicator in the Navigator, drag it onto your chart, and configure the input parameters in the popup window.
3. Customization: Press Ctrl+I to open the indicator list, select your tool, and click "Properties" to change colors, levels, or visual styles.
4. Updating: Replace the old file in the Indicators folder with the new version and restart the platform to apply changes.
Frequently Asked Questions
Q: Why is my indicator not showing? A: Verify the file is in the MQL/Indicators folder, or try right-clicking the "Indicators" tree in the Navigator and clicking "Refresh."
Q: Do custom indicators slow down the platform? A: Too many complex indicators can impact performance; remove unused ones via the "Indicator List" (Ctrl+I).
Q: Can I use MT4 indicators on MT5? A: No, MQL4 and MQL5 are distinct languages; ensure the indicator is compiled specifically for your platform version.
Description & Settings
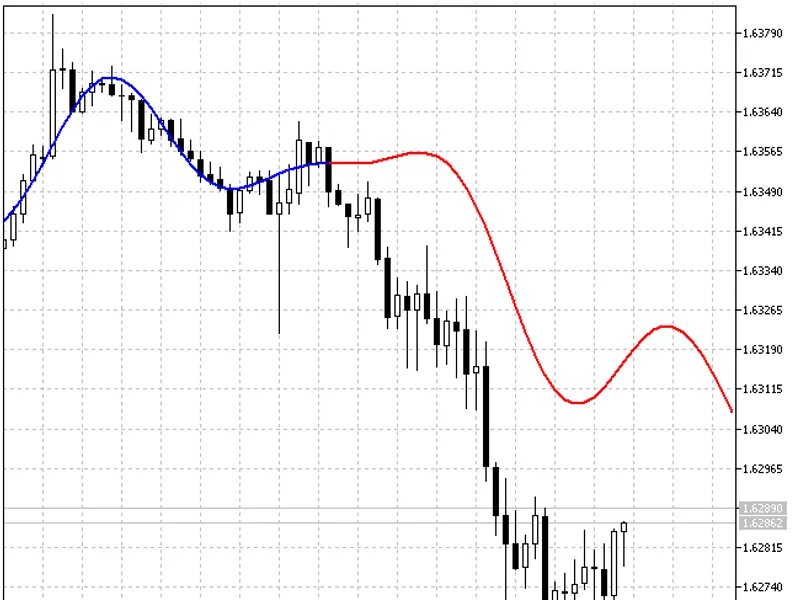
Extrapolator is a result of a long-term research in the field of Timeseries Forecasting. This indicator forecasts future price behavior. The indicator draws two lines: the blue one shows model prices on training bars, the red one shows predicted future prices.
The indicator is based on several methods that can be selected by the Method input variable:
Fourier's series extrapolation; the frequencies are calculated using Quinn-Fernandes Algorithm;
Autocorrelation Method;
Weighted Burg Method;
Burg Method with Helme-Nikias weighting function;
Itakura-Saito (geometric) method;
Modified covariance method.
Methods 2-6 are linear prediction methods. Linear prediction is based on finding of future values as linear functions of previous values. Assume that we have the x[0]..x[n-1] price range where the older index corresponds to more recent prices.
Forecasting of the x[n] future price is calculated as
where:
a[i=1..p] - model ratios;
p - model structure.
Named methods 2-6 find the a[] ratios by decreasing a mean-root-square error on the last training n-p bars. Of course, zero error forecast on training bars can be achieved by solving previously mentioned linear equation system directly at n=2*p using the Levinson-Durbin algorithm. Such a forecast method is called Prony Method. Its drawback is unstable forecasts of the future values of the range. Therefore, this method is not included.
Other input data are:
LastBar - last bar index at previous data;
PastBars - number of previous bars used to predict future values;
LPOrder - linear module structure as a share from the number of previous bars (0..1);
FutBars - number of future bars in a forecast;
HarmNo - maximum number of frequencies for Method 1 (0 selects all frequencies);
FreqTOL - measure of inaccuracy in frequencies calculation for Method 1 (>0.001 may not converge);
BurgWin - weighing function index for Method 2 (0=Rectangular, 1=Hamming, 2=Parabolic);
This indicator was first implemented in MQL4 and published in 9.12.2008.