Envelopes
This tool for MetaTrader 5 is specifically engineered to streamline your trading operations. This technical indicator acts as a specialized analysis tool designed to visualize market data. It helps traders identify emerging trends, momentum shifts, and key support or resistance levels by plotting statistical calculations directly onto price charts.
How to Setup and Use Envelopes
1. Installation: Place your file in the MQL/Indicators folder via "Open Data Folder" and restart your terminal.
2. Loading: Find the indicator in the Navigator, drag it onto your chart, and configure the input parameters in the popup window.
3. Customization: Press Ctrl+I to open the indicator list, select your tool, and click "Properties" to change colors, levels, or visual styles.
4. Updating: Replace the old file in the Indicators folder with the new version and restart the platform to apply changes.
Frequently Asked Questions
Q: Why is my indicator not showing? A: Verify the file is in the MQL/Indicators folder, or try right-clicking the "Indicators" tree in the Navigator and clicking "Refresh."
Q: Do custom indicators slow down the platform? A: Too many complex indicators can impact performance; remove unused ones via the "Indicator List" (Ctrl+I).
Q: Can I use MT4 indicators on MT5? A: No, MQL4 and MQL5 are distinct languages; ensure the indicator is compiled specifically for your platform version.
Description & Settings
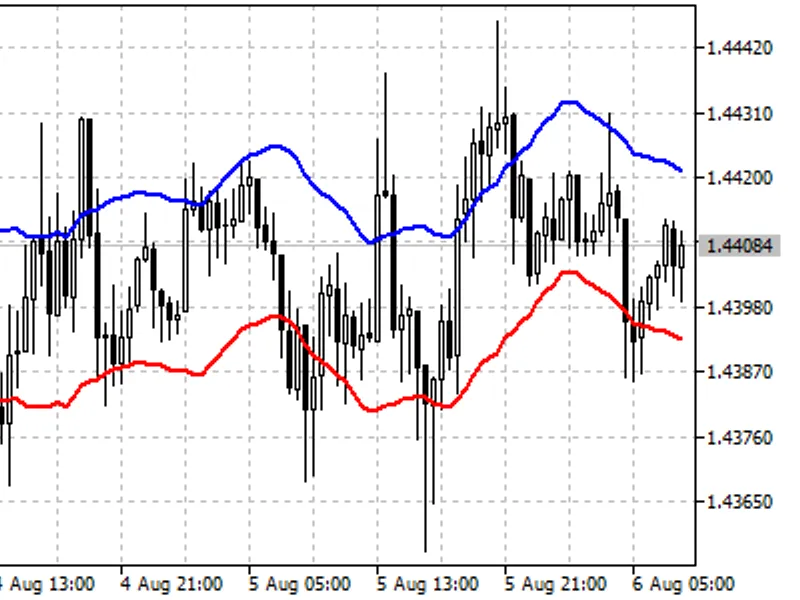
Envelopes technical indicator is formed with two Moving Averages, one of which is shifted upward and another one is shifted downward. The selection of optimum relative number of band margins shifting is determined with the market volatility: the higher the latter is, the stronger the shift is.
Envelopes define the upper and the lower margins of the price range. Signal to sell appears when the price reaches the upper margin of the band; signal to buy appears when the price reaches the lower margin.
The logic behind envelopes is that overzealous buyers and sellers push the price to the extremes (i.e., the upper and lower bands), at which point the prices often stabilize by moving to more realistic levels. This is similar to the interpretation of Bollinger Bands ® (BB).
Envelopes indicator
Calculation:
UPPER BAND = SMA (CLOSE, N) * [1 + K / 1000]LOWER BAND = SMA (CLOSE, N) * [1 - K / 1000]
where:
UPPER BAND - upper line of the indicator;
LOWER BAND - lower line of the indicator;
SMA - Simple Moving Average;
CLOSE - close price;
N - period of averaging;
K / 1000 - the value of shifting from the average (measured in basis points).