Dsl - CM O bars
This professional-grade solution for MetaTrader 5 helps traders achieve greater efficiency in their daily workflow. This technical indicator acts as a specialized analysis tool designed to visualize market data. It helps traders identify emerging trends, momentum shifts, and key support or resistance levels by plotting statistical calculations directly onto price charts.
How to Setup and Use Dsl - CM O bars
1. Installation: Place your file in the MQL/Indicators folder via "Open Data Folder" and restart your terminal.
2. Loading: Find the indicator in the Navigator, drag it onto your chart, and configure the input parameters in the popup window.
3. Customization: Press Ctrl+I to open the indicator list, select your tool, and click "Properties" to change colors, levels, or visual styles.
4. Updating: Replace the old file in the Indicators folder with the new version and restart the platform to apply changes.
Frequently Asked Questions
Q: Why is my indicator not showing? A: Verify the file is in the MQL/Indicators folder, or try right-clicking the "Indicators" tree in the Navigator and clicking "Refresh."
Q: Do custom indicators slow down the platform? A: Too many complex indicators can impact performance; remove unused ones via the "Indicator List" (Ctrl+I).
Q: Can I use MT4 indicators on MT5? A: No, MQL4 and MQL5 are distinct languages; ensure the indicator is compiled specifically for your platform version.
Description & Settings
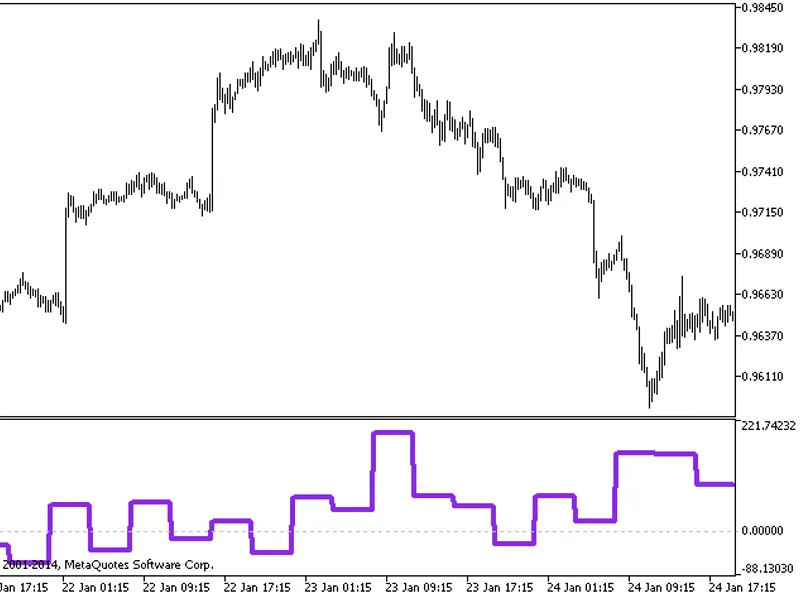
The Chande Momentum Oscillator is a technical momentum indicator invented by Tushar Chande. Chande introduced the indicator in his 1994 book "The New Technical Trader". It is created by calculating the difference between the sum of all recent gains and the sum of all recent losses and then dividing the result by the sum of all price movement over the period.
The Chande Momentum Oscillator formula is:
CMO = 100 x ((Su – Sd) / (Su + Sd))
where:
Su - sum of gains.
Sd - sum of losses.
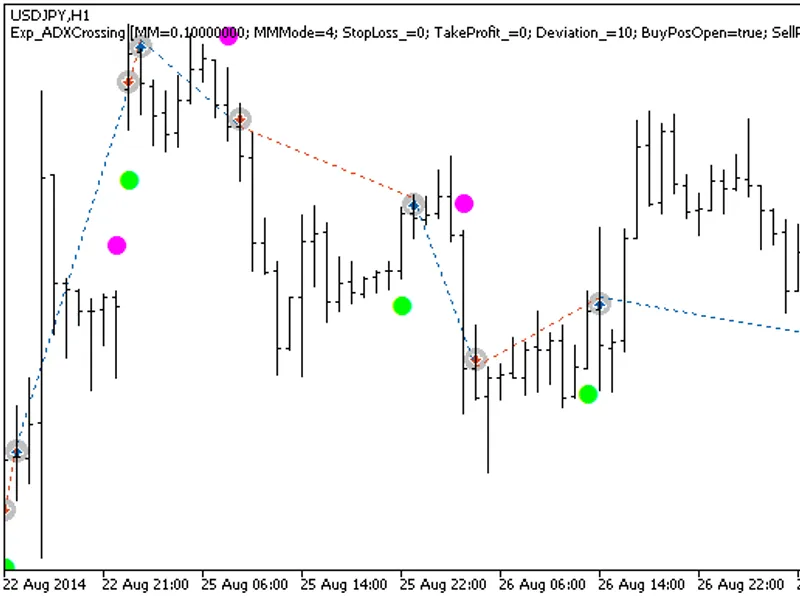
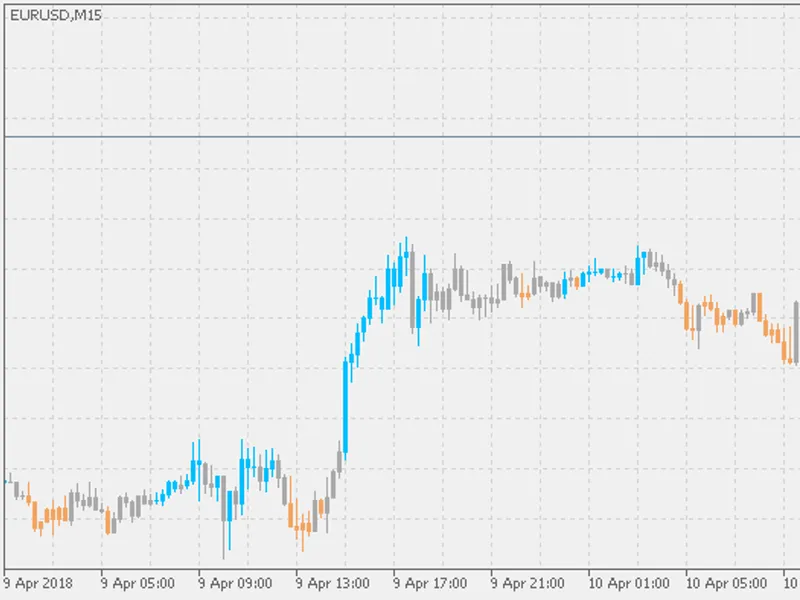
Also, instead of displaying it as an indicator in a separate window, it is displayed on the main chart as bars (if the current chart style is bars or line) or candles (it is done automatically) to make it easier to pinpoint when the momentum crosses the DSL levels.


![[EA] Charles-1. 3. 3](/images/10768.webp)