Fibonacci Zig Zag
This tool for MetaTrader 5 is specifically engineered to streamline your trading operations. This technical indicator acts as a specialized analysis tool designed to visualize market data. It helps traders identify emerging trends, momentum shifts, and key support or resistance levels by plotting statistical calculations directly onto price charts.
How to Setup and Use Fibonacci Zig Zag
1. Installation: Place your file in the MQL/Indicators folder via "Open Data Folder" and restart your terminal.
2. Loading: Find the indicator in the Navigator, drag it onto your chart, and configure the input parameters in the popup window.
3. Customization: Press Ctrl+I to open the indicator list, select your tool, and click "Properties" to change colors, levels, or visual styles.
4. Updating: Replace the old file in the Indicators folder with the new version and restart the platform to apply changes.
Frequently Asked Questions
Q: Why is my indicator not showing? A: Verify the file is in the MQL/Indicators folder, or try right-clicking the "Indicators" tree in the Navigator and clicking "Refresh."
Q: Do custom indicators slow down the platform? A: Too many complex indicators can impact performance; remove unused ones via the "Indicator List" (Ctrl+I).
Q: Can I use MT4 indicators on MT5? A: No, MQL4 and MQL5 are distinct languages; ensure the indicator is compiled specifically for your platform version.
Description & Settings
We will need :
1 zigzag plot
2 data buffers for the highs and the lows
input parameters
an ongoing set of system variables which reset whenever the indicator recalculates
The
upWaves
array will store the highs and the
dwWaves
array will store the lows
System variables :
we need to know the last wave type , where it started , where it ended , the distance in bars from the start and the end.
Then we need a local high and local low variable as well as distances in bars from each point.
Finally the rolling atr unit and how many have been calculated
We then create a system reset function :
Standard stuff , fill the arrays with zeroes and reset the system variables.
Oninit we setup the buffers , the plot , and we call reset for the first time :
So let's jump right in the calculation.
The first thing we need to take care of is the rolling atr.
Until we have collected more bars that the atr period we will not do anything else.
The portion that manages the rolling atr is as follows :
if we have not collected more than the period keep adding the range of the bars found to a summation
once we hit the period we perform the first division (average)
after that we clip one portion of the rolling atr off , which is atr/period , and then add a new portion which is range of bar / period we place the last part first because it will happen more often and we wont need to be accessing 2 if statements
Awesome , now , there is another issue.
The foundation of this zig zag is a retracement .
But for a retracement to occur there must be at least one wave.
But what will the first wave retrace ? xD
For that reason we will do the following :
as soon as the atr fills up (atr collected = period) , we will grab the high and the low in our system variables
whichever side manages to form a wave that has a valid size in atr units , and forms a new high (upwave) or a new low (down wave) wins
this way we dont have a retracement as an initial wave , but , we gotta start the sequence somehow.
Note we could have also opted in to have a classic fractal approach here for the first wave only and then continue onwards with retracements.
This is what we do as long as we don't have a wave :
Great . Now the final piece.
If we have an upwave :
if a new high is made , move the zigzag from the previous high position to the new high position which we can do since we retain bar distances.Also update the low and the distance from the low.We do that so we can catch the lowest low since the peak and check if it retraces enough in order to start a new low
if a new low is made , or , a new low is set , we calculate the distance from the peak to the low and divide it by the wave size . And also multiply it with 100 to match the input parameter scale.So if the wave size is 100 points and the retracement is 24 points we get 24/100 0.24 , then x 100 24% . If the size of the new "would be" wave that retraces the previous one is also valid against the atr units we start a new down wave, set the new local highs and lows , set the bar distances.
here is the relevant code for the above :
We do the opposite when we have a down wave.
And we are done , our retracement zig zag is ready.
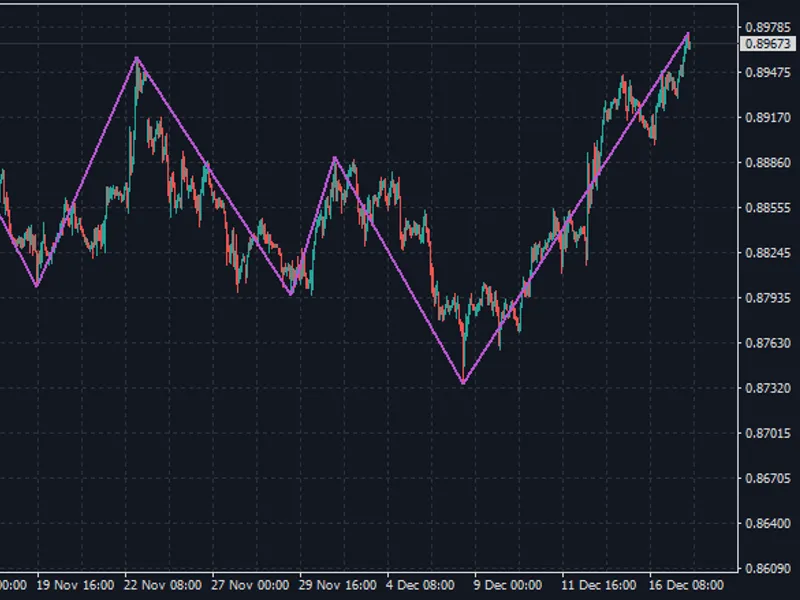
Here is the zigzag with
23.6%
retracement and
0.0 min size of waves in atr units
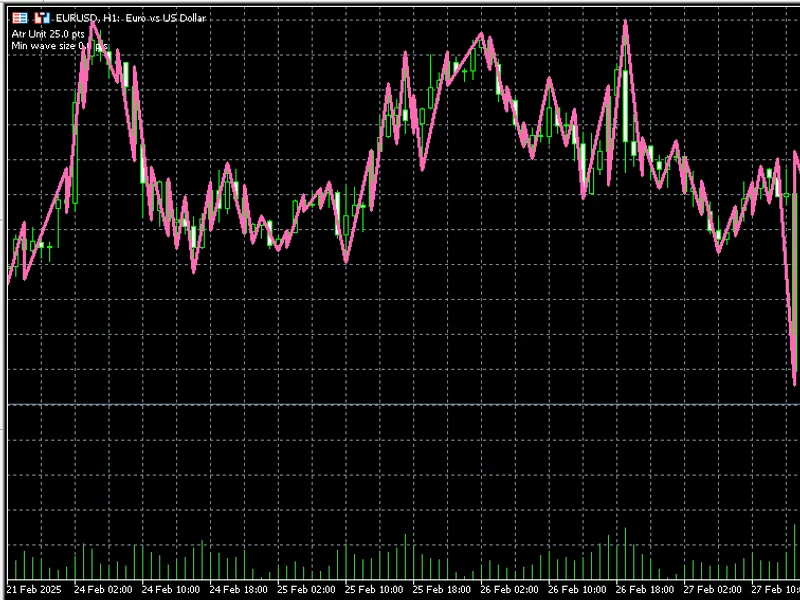
and here is the same zig zag with
3 min size of waves in atr units