DR A W FILL I N G
This software component for MetaTrader 5 is built to enhance the capabilities of your trading environment. This technical indicator acts as a specialized analysis tool designed to visualize market data. It helps traders identify emerging trends, momentum shifts, and key support or resistance levels by plotting statistical calculations directly onto price charts.
How to Setup and Use DR A W FILL I N G
1. Installation: Place your file in the MQL/Indicators folder via "Open Data Folder" and restart your terminal.
2. Loading: Find the indicator in the Navigator, drag it onto your chart, and configure the input parameters in the popup window.
3. Customization: Press Ctrl+I to open the indicator list, select your tool, and click "Properties" to change colors, levels, or visual styles.
4. Updating: Replace the old file in the Indicators folder with the new version and restart the platform to apply changes.
Frequently Asked Questions
Q: Why is my indicator not showing? A: Verify the file is in the MQL/Indicators folder, or try right-clicking the "Indicators" tree in the Navigator and clicking "Refresh."
Q: Do custom indicators slow down the platform? A: Too many complex indicators can impact performance; remove unused ones via the "Indicator List" (Ctrl+I).
Q: Can I use MT4 indicators on MT5? A: No, MQL4 and MQL5 are distinct languages; ensure the indicator is compiled specifically for your platform version.
Description & Settings
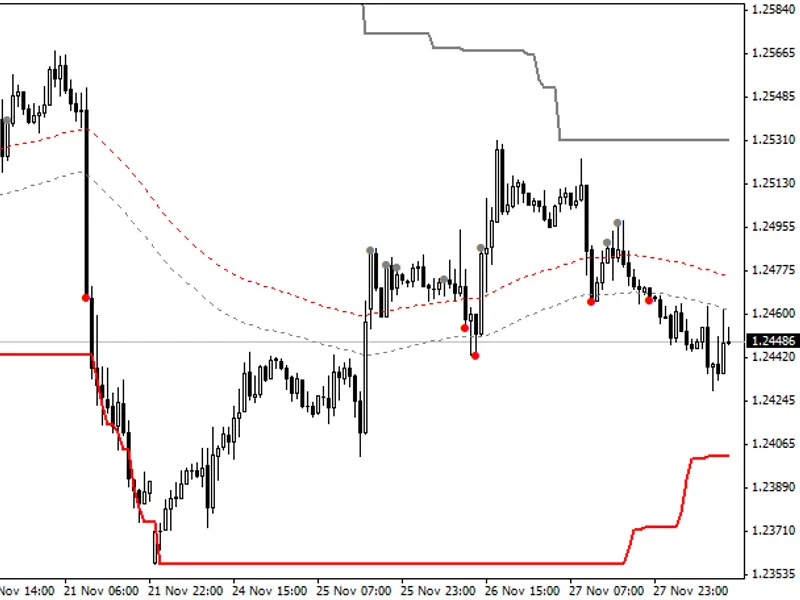
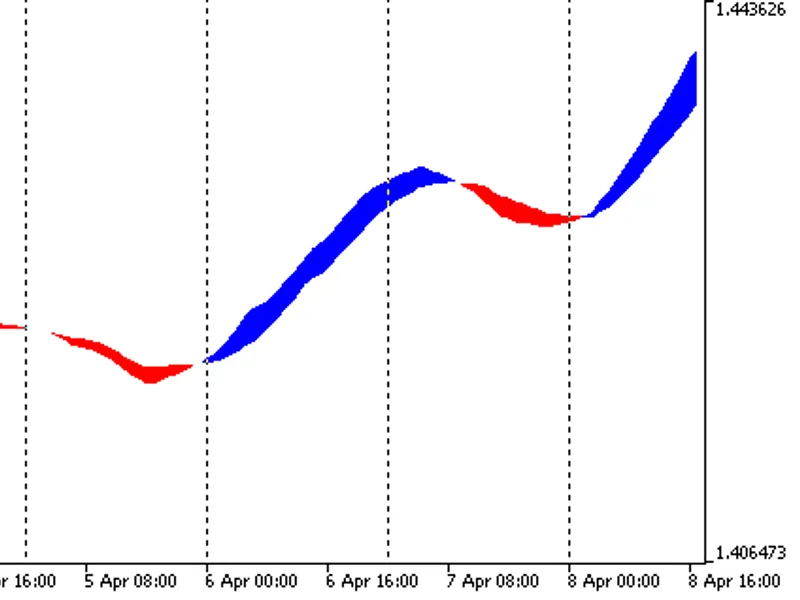
The indicator plots a channel based on two moving averages with different periods in the separate window.
The change of the channel color shows the change of the trend.
The drawing style plots the filled area between the values of two indicator buffers. In fact, it plots two lines and fills the area between them with the specified color. The colors of the channel changed after N ticks. The N variable is defined as input parameter, it can be changed using the "Properties" window.
Note that initial properties of the plot1 graphic plot () are defined using the # preprocessor directive, further these properties changed randomly ( function).
See also: .
Image: