Double Exponential Moving Average (DE M A)
This software component for MetaTrader 5 is built to enhance the capabilities of your trading environment. This technical indicator acts as a specialized analysis tool designed to visualize market data. It helps traders identify emerging trends, momentum shifts, and key support or resistance levels by plotting statistical calculations directly onto price charts.
How to Setup and Use Double Exponential Moving Average (DE M A)
1. Installation: Place your file in the MQL/Indicators folder via "Open Data Folder" and restart your terminal.
2. Loading: Find the indicator in the Navigator, drag it onto your chart, and configure the input parameters in the popup window.
3. Customization: Press Ctrl+I to open the indicator list, select your tool, and click "Properties" to change colors, levels, or visual styles.
4. Updating: Replace the old file in the Indicators folder with the new version and restart the platform to apply changes.
Frequently Asked Questions
Q: Why is my indicator not showing? A: Verify the file is in the MQL/Indicators folder, or try right-clicking the "Indicators" tree in the Navigator and clicking "Refresh."
Q: Do custom indicators slow down the platform? A: Too many complex indicators can impact performance; remove unused ones via the "Indicator List" (Ctrl+I).
Q: Can I use MT4 indicators on MT5? A: No, MQL4 and MQL5 are distinct languages; ensure the indicator is compiled specifically for your platform version.
Description & Settings
Double Exponential Moving Average technical Indicator (DEMA) was developed by Patrick Mulloy and published in February 1994 in the "Technical Analysis of Stocks & Commodities" magazine.
It is used for smoothing price series and is applied directly on a price chart of a financial security. Besides, it can be used for smoothing values of other indicators.
The advantage of this indicator is that it eliminates false signals at the saw-toothed price movement and allows saving a position at a strong trend.
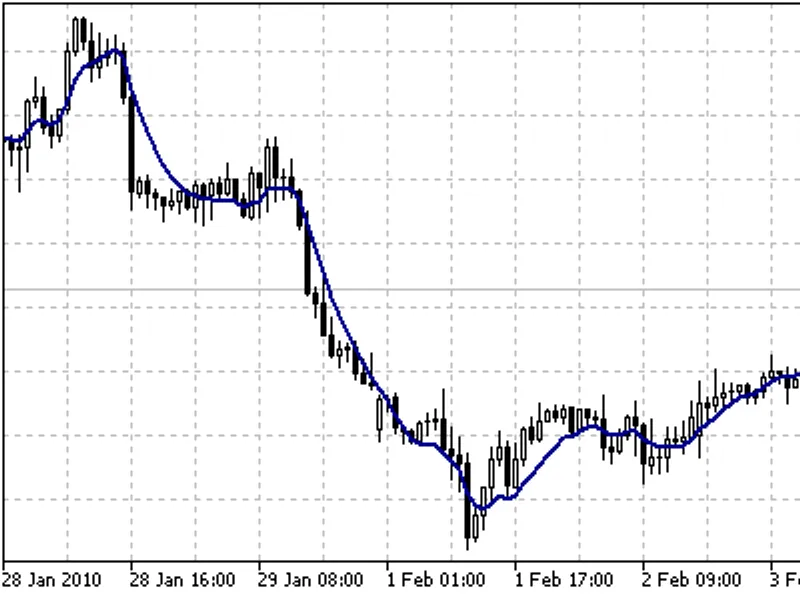
Double Exponential Moving Average Indicator
Calculation:
This indicator is based on the Exponential Moving Average (EMA). Let's view the error of price deviation from EMA value:
err(i) = Price(i) - EMA(Price, N, i)
where:
err(i) - current EMA error;
Price(i) - current price;
EMA(Price, N, i) - current EMA value of Price series with N period.
Let's add the value of the exponential average error to the value of the exponential moving average of a price and we will receive DEMA:
DEMA(i) = EMA(Price, N, i) + EMA(err, N, i) = EMA(Price, N, i) + EMA(Price - EMA(Price, N, i), N, i) == 2 * EMA(Price, N, i) - EMA(Price - EMA(Price, N, i), N, i) = 2 * EMA(Price, N, i) - EMA2(Price, N, i)
where:
EMA(err, N, i) - current value of the exponential average of error err;
EMA2(Price, N, i) - current value of the double consequential smoothing of prices.