CC I with on chart SR levels
This is a powerful addition to your MetaTrader 5 toolkit designed to optimize market analysis and performance. This technical indicator acts as a specialized analysis tool designed to visualize market data. It helps traders identify emerging trends, momentum shifts, and key support or resistance levels by plotting statistical calculations directly onto price charts.
How to Setup and Use CC I with on chart SR levels
1. Installation: Place your file in the MQL/Indicators folder via "Open Data Folder" and restart your terminal.
2. Loading: Find the indicator in the Navigator, drag it onto your chart, and configure the input parameters in the popup window.
3. Customization: Press Ctrl+I to open the indicator list, select your tool, and click "Properties" to change colors, levels, or visual styles.
4. Updating: Replace the old file in the Indicators folder with the new version and restart the platform to apply changes.
Frequently Asked Questions
Q: Why is my indicator not showing? A: Verify the file is in the MQL/Indicators folder, or try right-clicking the "Indicators" tree in the Navigator and clicking "Refresh."
Q: Do custom indicators slow down the platform? A: Too many complex indicators can impact performance; remove unused ones via the "Indicator List" (Ctrl+I).
Q: Can I use MT4 indicators on MT5? A: No, MQL4 and MQL5 are distinct languages; ensure the indicator is compiled specifically for your platform version.
Description & Settings
Theory :
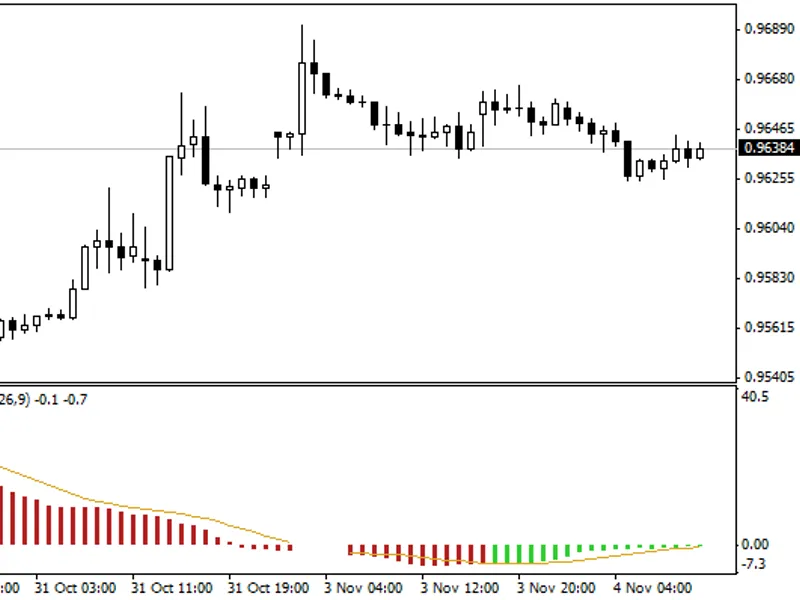
The idea for this indicator is as simple as it gets : a lot of times we are using some indicator levels as a signal that some desired level is reached and that the price change is to be used as an entry or exit price for our orders / positions. That is all OK but many times we simply are comparing the prices only visually. This indicator is a sort of a "helper" for that. What it does :
it waits for a level break (CCI in this case)
if it was broken, then it checks if a new trend line at the chart should be displayed
if it remains in the over bought or oversold area, it adjusts the existing SR level displayed on chart
if it retraces in to the neutral zone, the line update is canceled and a new signal is waited for
Th indicator, as it is, is mainly meant to be used in manual trading.
Usage :
The same as any CCI.
PS:
The "big picture" example that shows in a more clear way how the indicator works and what is it showing us on chart