
Timeframe Flow
This software component for MetaTrader 4 is built to enhance the capabilities of your trading environment. This technical indicator acts as a specialized analysis tool designed to visualize market data. It helps traders identify emerging trends, momentum shifts, and key support or resistance levels by plotting statistical calculations directly onto price charts.
How to Setup and Use Timeframe Flow
1. Installation: Place your file in the MQL/Indicators folder via "Open Data Folder" and restart your terminal.
2. Loading: Find the indicator in the Navigator, drag it onto your chart, and configure the input parameters in the popup window.
3. Customization: Press Ctrl+I to open the indicator list, select your tool, and click "Properties" to change colors, levels, or visual styles.
4. Updating: Replace the old file in the Indicators folder with the new version and restart the platform to apply changes.
Frequently Asked Questions
Q: Why is my indicator not showing? A: Verify the file is in the MQL/Indicators folder, or try right-clicking the "Indicators" tree in the Navigator and clicking "Refresh."
Q: Do custom indicators slow down the platform? A: Too many complex indicators can impact performance; remove unused ones via the "Indicator List" (Ctrl+I).
Q: Can I use MT4 indicators on MT5? A: No, MQL4 and MQL5 are distinct languages; ensure the indicator is compiled specifically for your platform version.
Description & Settings
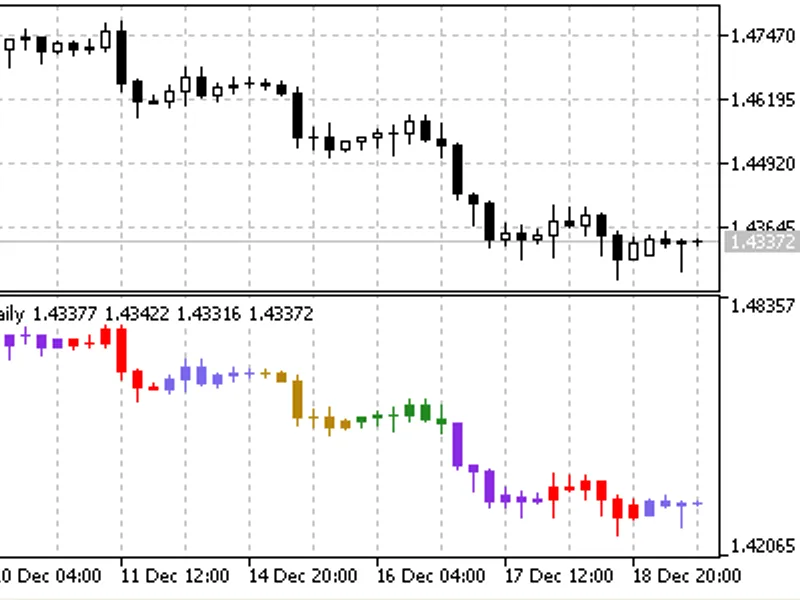
Sharing this trend indicator made by me. Called "Timeframe Flow".
It will draw a user defined higher time-frame candle on every shift on your current time-frame.
Meaning you can have H4, H12 or D1 candles on every shift of your H1 Charts.
Or you can have D2, D3 or D5 candles on every shift of your Daily Charts.
Combined with the current time-frame ATR Bands, you have a trend indicator with some filter.
You may also use the Mid Line crosses as exit( Calculated using Higher timeframe candles displayed in the indicator(Close + Open)/2 ).


![MACD Histogram, multi-timeframe, multi-color [v03]](/images/176.webp)
