Demo Buffer Pattern
This software component for MetaTrader 5 is built to enhance the capabilities of your trading environment. This technical indicator acts as a specialized analysis tool designed to visualize market data. It helps traders identify emerging trends, momentum shifts, and key support or resistance levels by plotting statistical calculations directly onto price charts.
How to Setup and Use Demo Buffer Pattern
1. Installation: Place your file in the MQL/Indicators folder via "Open Data Folder" and restart your terminal.
2. Loading: Find the indicator in the Navigator, drag it onto your chart, and configure the input parameters in the popup window.
3. Customization: Press Ctrl+I to open the indicator list, select your tool, and click "Properties" to change colors, levels, or visual styles.
4. Updating: Replace the old file in the Indicators folder with the new version and restart the platform to apply changes.
Frequently Asked Questions
Q: Why is my indicator not showing? A: Verify the file is in the MQL/Indicators folder, or try right-clicking the "Indicators" tree in the Navigator and clicking "Refresh."
Q: Do custom indicators slow down the platform? A: Too many complex indicators can impact performance; remove unused ones via the "Indicator List" (Ctrl+I).
Q: Can I use MT4 indicators on MT5? A: No, MQL4 and MQL5 are distinct languages; ensure the indicator is compiled specifically for your platform version.
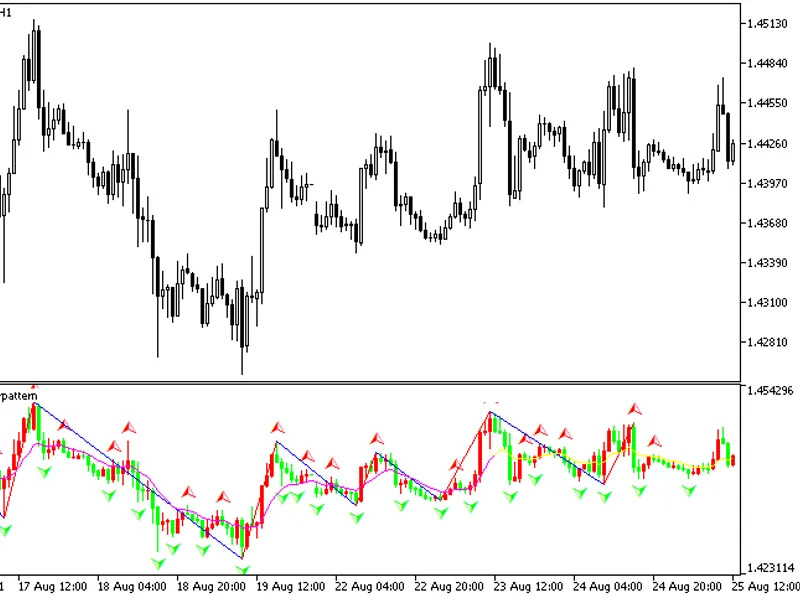
Description & Settings
A indicator to demo buffer-pattern: Candles + Fractals + ZigzagColor + ColorMaLine.
It uses the folllowing drawing styles:
DRAW_COLOR_CANDLES
DRAW_ARROW
DRAW_COLOR_ZIGZAG
DRAW_COLOR_LINE //+------------------------------------------------------------------+ //| Custom indicator initialization function | //+------------------------------------------------------------------+ int OnInit() { //--- indicator buffers mapping SetIndexBuffer( 0,P1B1,INDICATOR_DATA); SetIndexBuffer( 1,P1B2,INDICATOR_DATA); SetIndexBuffer( 2,P1B3,INDICATOR_DATA); SetIndexBuffer( 3,P1B4,INDICATOR_DATA); SetIndexBuffer( 4,P1BC,INDICATOR_COLOR_INDEX); SetIndexBuffer( 5,P2B1,INDICATOR_DATA); SetIndexBuffer( 6,P3B1,INDICATOR_DATA); SetIndexBuffer( 7,P4B1,INDICATOR_DATA); SetIndexBuffer( 8,P4B2,INDICATOR_DATA); SetIndexBuffer( 9,P4BC,INDICATOR_COLOR_INDEX); SetIndexBuffer(10,P5B1,INDICATOR_DATA); SetIndexBuffer(11,P5BC,INDICATOR_COLOR_INDEX); //--- Auxiliary buffers for intermediate calculations SetIndexBuffer(12,P4M1,INDICATOR_CALCULATIONS); SetIndexBuffer(13,P4M2,INDICATOR_CALCULATIONS); //--- They should be placed after all the buffer to be displayed, or else ... you can try it by youself //--- ARROW PlotIndexSetInteger(1,PLOT_ARROW,217); PlotIndexSetInteger(2,PLOT_ARROW,218); PlotIndexSetInteger(1,PLOT_ARROW_SHIFT,-iArrowShift); PlotIndexSetInteger(2,PLOT_ARROW_SHIFT,iArrowShift); PlotIndexSetDouble(1,PLOT_EMPTY_VALUE,EMPTY_VALUE); PlotIndexSetDouble(2,PLOT_EMPTY_VALUE,EMPTY_VALUE); //--- ZIGZAG PlotIndexSetDouble(3,PLOT_EMPTY_VALUE,0.0); //--- MA maHandle=iMA(Symbol(),0,ExtPeriod,0,MODE_EMA,PRICE_CLOSE); return(0); } //+------------------------------------------------------------------+ //| Custom indicator iteration function | //+------------------------------------------------------------------+ int OnCalculate(const int rates_total, const int prev_calculated, const datetime& time[], const double& open[], const double& high[], const double& low[], const double& close[], const long& tick_volume[], const long& volume[], const int& spread[]) { //--- CalcCandles(rates_total,prev_calculated,open,high,low,close); CalcFractal(rates_total,prev_calculated,high,low,P2B1,P3B1); CalcZigzag (rates_total,prev_calculated,high,low,P4B1,P4B2,P4BC,P4M1,P4M2); CalcColorMA(rates_total,prev_calculated,P5B1,P5BC); //--- return value of prev_calculated for next call return(rates_total); }