Stochastic Momentum Colour Candles
This is a powerful addition to your MetaTrader 5 toolkit designed to optimize market analysis and performance. This technical indicator acts as a specialized analysis tool designed to visualize market data. It helps traders identify emerging trends, momentum shifts, and key support or resistance levels by plotting statistical calculations directly onto price charts.
How to Setup and Use Stochastic Momentum Colour Candles
1. Installation: Place your file in the MQL/Indicators folder via "Open Data Folder" and restart your terminal.
2. Loading: Find the indicator in the Navigator, drag it onto your chart, and configure the input parameters in the popup window.
3. Customization: Press Ctrl+I to open the indicator list, select your tool, and click "Properties" to change colors, levels, or visual styles.
4. Updating: Replace the old file in the Indicators folder with the new version and restart the platform to apply changes.
Frequently Asked Questions
Q: Why is my indicator not showing? A: Verify the file is in the MQL/Indicators folder, or try right-clicking the "Indicators" tree in the Navigator and clicking "Refresh."
Q: Do custom indicators slow down the platform? A: Too many complex indicators can impact performance; remove unused ones via the "Indicator List" (Ctrl+I).
Q: Can I use MT4 indicators on MT5? A: No, MQL4 and MQL5 are distinct languages; ensure the indicator is compiled specifically for your platform version.
Description & Settings
Based on the Stochastic Momentum Indicator according to William Blau by Andrey F. Zelinsky , I came up with the idea of not only showing the closing price but also finding out more about the development of the bars. The idea with the bars is not new either, the principle can be found here:
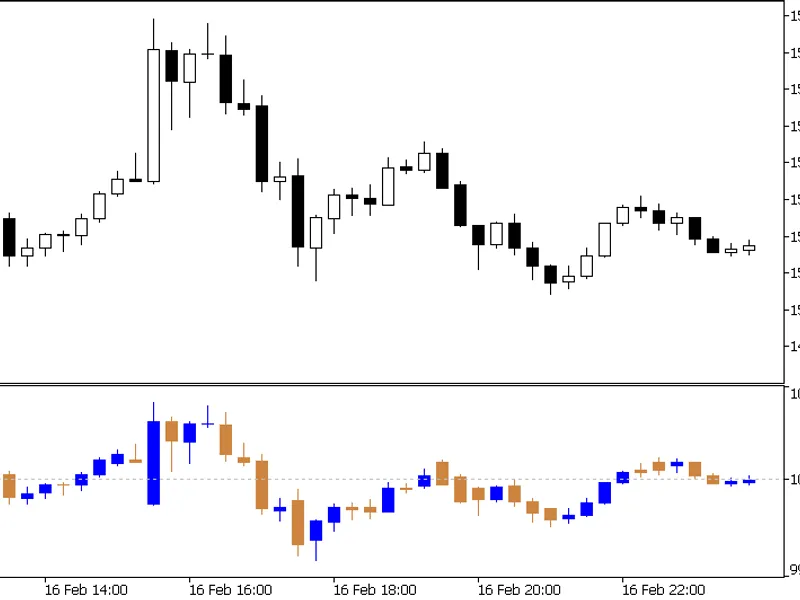
Not much has changed, except that the calculation of the stochastic momentum has been carried out for all four buffers (OHLC).
There are two formulas of the stochastic momentum with period q:
StochMom(price,q) = price - 1/2 * [LL(q) + HH(q)]
(the result is an absolute value of the price movement compared to the mean value)
resp.
StochMom(price,q) = (100 * price) / (1/2 * [LL(q) + HH(q)])
(the result is a percentage value of the price movement when the mean value is 100%)
These are both implemented and can be switched using InpFormula.
The stochastic momentum indicates how far the closing price of the last bar has moved away from the average between the highest and lowest price of the last q bars. However, this calculation can be performed in exactly the same way for open, high and low.
Stochastic momentum can be used in a similar way to normal momentum. Trends are indicated by the value remaining above or below the centre line for a longer period of time. Crossing the centre line can indicate a change in direction. After a longer trend in particular, crossing and then crossing back over the centre line can indicate a continuation of the trend. You can also query the colour buffer to find out the direction of the bar movement.
Sometimes the movement of the current bar goes so far that the centre line shifts and the bar is displayed shifted (long bar in the image above). Whether this artefact is useful or not has yet to be tested.


![Premier Stochastic Oscillator [v01]](/images/339.webp)